Advertisement
Is It Too Late To Consider Benchmark Electronics (BHE) After Its Strong Multi‑Year Share Price Run?

Reviewed by Bailey Pemberton
- If you are wondering whether Benchmark Electronics is still reasonably priced after a strong run, you are not alone. This article is built to help you test what you are really paying for at today’s share price.
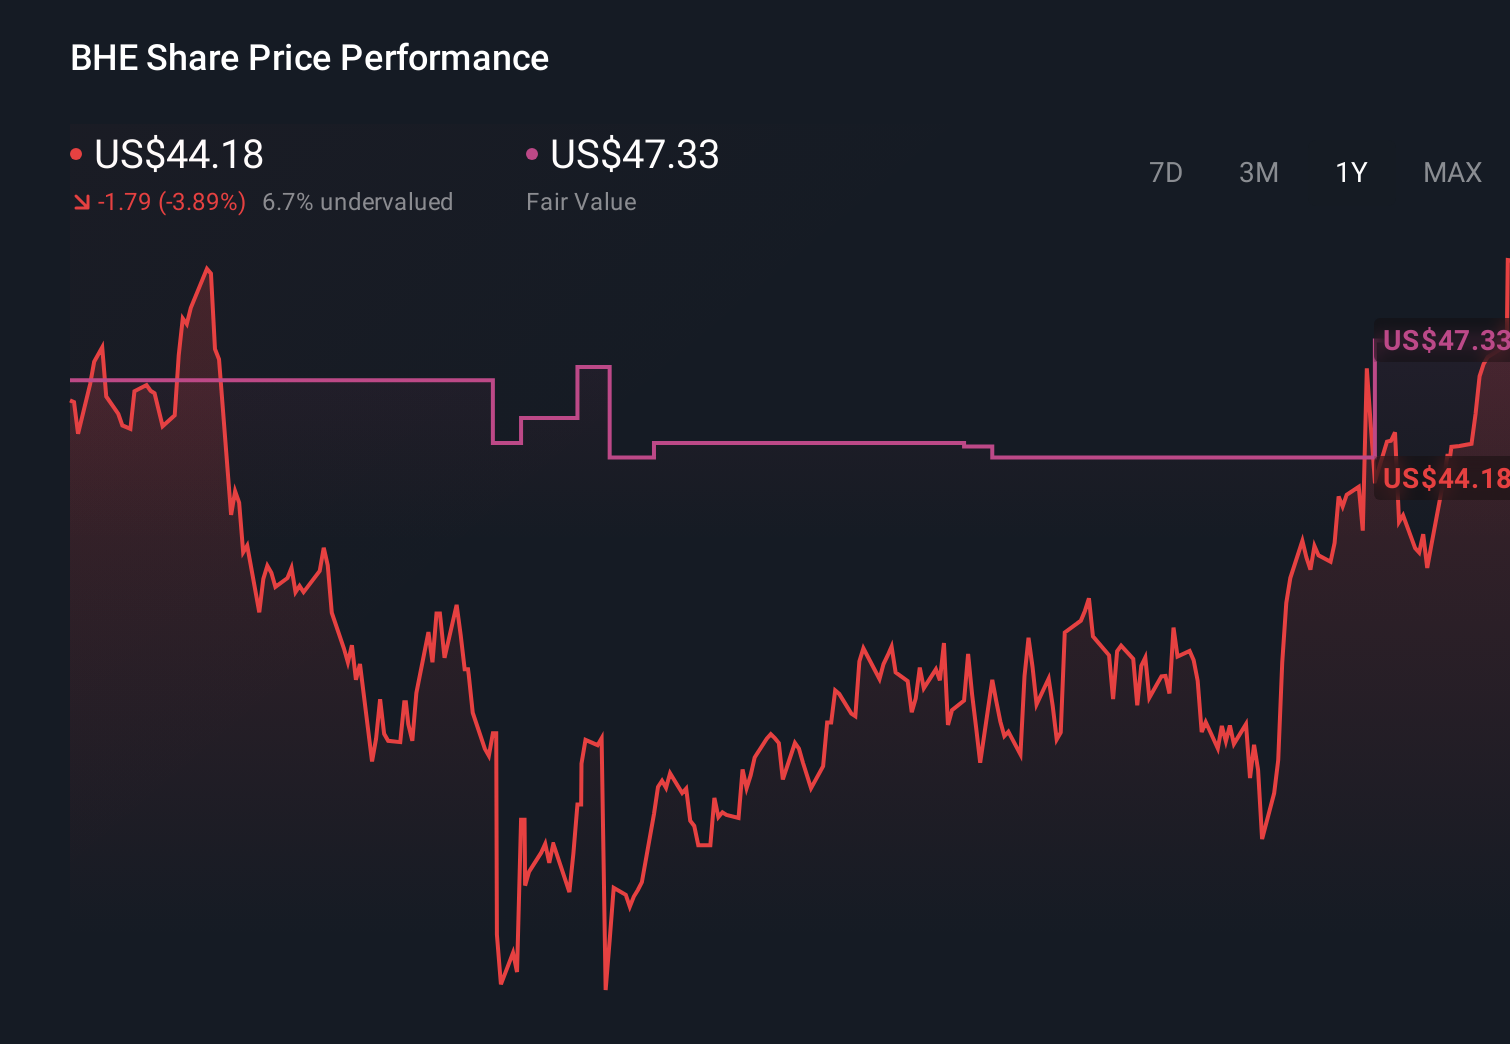
- The stock last closed at US$58.30, with returns of 11.8% over 7 days, 30.7% over 30 days, 32.8% year to date, 42.2% over 1 year, 146.3% over 3 years and 133.9% over 5 years. This performance has put valuation questions front and centre for many investors.
- Recent news coverage has focused on Benchmark Electronics as an established player in electronics manufacturing and engineering services, with attention on how it positions itself across end markets such as industrial and technology hardware. This context helps frame the recent share price strength as investors reassess what they are willing to pay for that business profile and balance sheet.
- On our checks, Benchmark Electronics has a valuation score of 0 out of 6. This suggests the company does not screen as undervalued on any of the six tests we will walk through next, and we will also finish by looking at a more rounded way to think about valuation beyond any single model.
Benchmark Electronics scores just 0/6 on our valuation checks. See what other red flags we found in the full valuation breakdown.
Approach 1: Benchmark Electronics Discounted Cash Flow (DCF) Analysis
A Discounted Cash Flow, or DCF, model projects a company’s future cash flows and then discounts them back to today using a required rate of return. The idea is simple: you estimate how much cash the business could return to shareholders over time and ask what that stream is worth in today’s dollars.
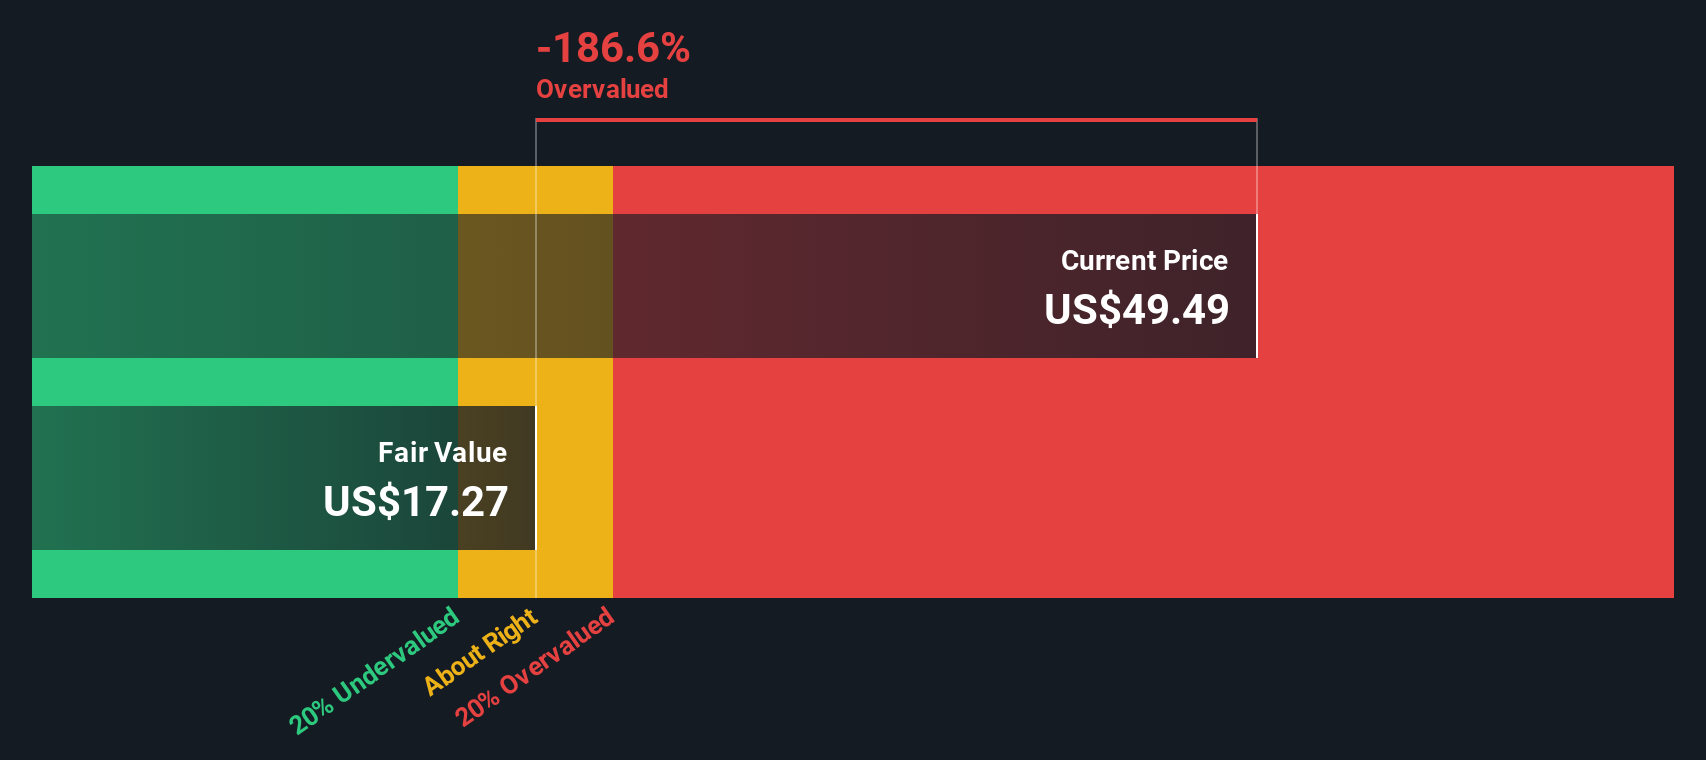
For Benchmark Electronics, the model used is a 2 Stage Free Cash Flow to Equity approach. The company’s latest twelve month free cash flow is US$74.29 million. Based on analyst input and further extrapolation, projected free cash flow runs from US$60.70 million in 2026 down to about US$19.73 million in 2035, all in US$ terms. These projections are then discounted back to today using the DCF framework.
Putting this together, the model arrives at an estimated intrinsic value of about US$10.11 per share. Against the recent share price of US$58.30, the implied gap suggests the stock is trading well above this DCF-based estimate of intrinsic value, indicating it screens as heavily overvalued rather than close to fair value.
Result: OVERVALUED
Our Discounted Cash Flow (DCF) analysis suggests Benchmark Electronics may be overvalued by 476.7%. Discover 53 high quality undervalued stocks or create your own screener to find better value opportunities.
Approach 2: Benchmark Electronics Price vs Earnings
For a profitable company, the P/E ratio is a useful shorthand for what the market is paying for each dollar of earnings. Investors usually accept a higher P/E if they expect stronger growth or see the business as lower risk, and a lower P/E if they see slower growth, more cyclicality or higher uncertainty.
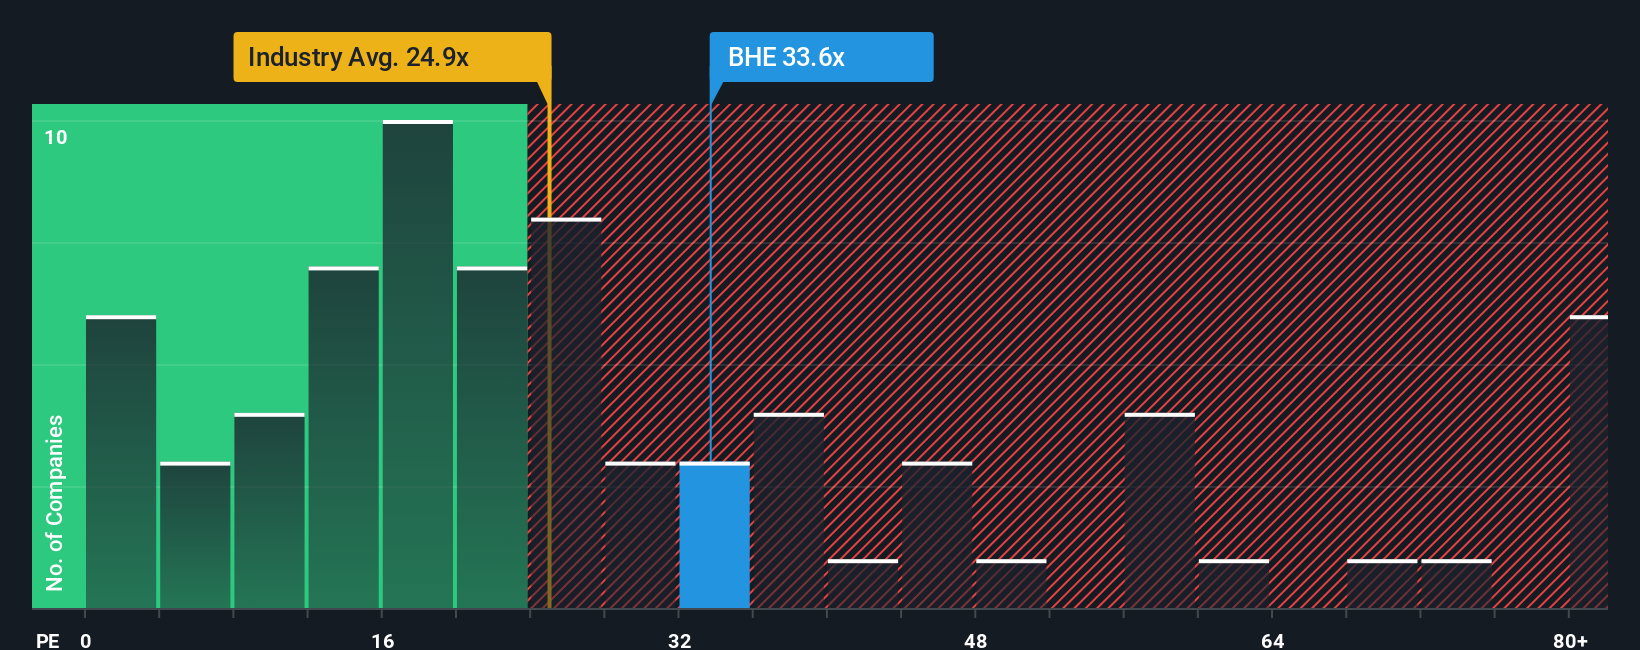
Benchmark Electronics currently trades on a P/E of 83.70x. That sits above both the Electronic industry average P/E of 26.22x and the peer group average of 66.23x. On the face of it, you are paying a richer price tag than for the typical sector peer.
Simply Wall St’s Fair Ratio metric aims to refine that comparison. It estimates what a more appropriate P/E might be after factoring in elements like earnings growth, profitability, industry, market cap and specific risks. That makes it more tailored than a simple peer or industry average check. For Benchmark Electronics, the Fair Ratio is 41.99x, which is well below the current 83.70x, pointing to a share price that is stretched relative to this earnings based yardstick.
Result: OVERVALUED
P/E ratios tell one story, but what if the real opportunity lies elsewhere? Start investing in legacies, not executives. Discover our 22 top founder-led companies.
Upgrade Your Decision Making: Choose your Benchmark Electronics Narrative
Earlier we mentioned that there is an even better way to understand valuation, so let us introduce you to Narratives, where you set out your story for Benchmark Electronics and connect that story directly to your own assumptions for future revenue, earnings, margins and fair value.
A Narrative is simply your view of what the business is, how it could perform, and what you think that is worth, all expressed through a financial forecast that links the company’s story to numbers and then to a fair value you can compare with today’s share price.
On Simply Wall St’s Community page, used by millions of investors, Narratives are built into the platform so you can quickly plug in forecasts, see the implied fair value, and compare it to the current price to help you decide whether you see Benchmark Electronics as a potential opportunity or something to avoid.
Narratives also update automatically as new information such as earnings releases or news is added, and you will often see very different views for the same stock. For example, one Benchmark Electronics Narrative might assume a very high fair value, while another assumes a much lower fair value based on a more cautious outlook.
Do you think there's more to the story for Benchmark Electronics? Head over to our Community to see what others are saying!
This article by Simply Wall St is general in nature. We provide commentary based on historical data and analyst forecasts only using an unbiased methodology and our articles are not intended to be financial advice. It does not constitute a recommendation to buy or sell any stock, and does not take account of your objectives, or your financial situation. We aim to bring you long-term focused analysis driven by fundamental data. Note that our analysis may not factor in the latest price-sensitive company announcements or qualitative material. Simply Wall St has no position in any stocks mentioned.
Valuation is complex, but we're here to simplify it.
Discover if Benchmark Electronics might be undervalued or overvalued with our detailed analysis, featuring fair value estimates, potential risks, dividends, insider trades, and its financial condition.
Access Free AnalysisHave feedback on this article? Concerned about the content? Get in touch with us directly. Alternatively, email editorial-team@simplywallst.com
About NYSE:BHE
Benchmark Electronics
Offers product design, engineering services, technology solutions, and manufacturing services in the Americas, Asia, and Europe.
Excellent balance sheet with moderate growth potential.
Similar Companies
Market Insights


Advertisement
Weekly Picks
LO


Lou_Basenese on Virtuix Holdings ·
From a “Shark Tank” Snub to an Air Force “Yes”: Why Virtuix at $3.50 May Be the Market’s Most Mispriced AI Story
Fair Value:US$7.556.7% undervalued
35 followersusers have followed this narrative
0 commentsusers have commented on this narrative
6 likesusers have liked this narrative
HE


HedgeY on IonQ ·
The Best-Funded Quantum Platform and Still a Stock Priced for Perfection
Fair Value:US$487.1% overvalued
24 followersusers have followed this narrative
0 commentsusers have commented on this narrative
4 likesusers have liked this narrative
BL


BlackGoat on Cerebras Systems ·
The Wafer Giant Threatening NVIDIA's GPU Hegemony
Fair Value:US$415.5446.8% undervalued
38 followersusers have followed this narrative
1 commentusers have commented on this narrative
7 likesusers have liked this narrative
IV

Ivoed on Netflix ·
Netflix’s Business Quality Is Clear. The Harder Question Is Whether The Stock Is Still Cheap
Fair Value:US$829.5% undervalued
22 followersusers have followed this narrative
0 commentsusers have commented on this narrative
7 likesusers have liked this narrative
Recently Updated Narratives
BR

Bravosatya on Meta Platforms ·
Meta Platforms - Zuckerberg’s investment decisions are impulsive or Prudent?
Fair Value:US$730.0216.0% undervalued
2 followersusers have followed this narrative
0 commentsusers have commented on this narrative
0 likesusers have liked this narrative
JU

julio on FIGS ·
Figs valuation
Fair Value:US$14.3930.2% undervalued
20 followersusers have followed this narrative
6 commentsusers have commented on this narrative
0 likesusers have liked this narrative
AS


AstrisCorporateAdvisory on MIRAI ·
Improving NOI growth visibility on wider rent gap
Fair Value:JP¥77.06k46.1% undervalued
1 followerusers have followed this narrative
0 commentsusers have commented on this narrative
0 likesusers have liked this narrative
Popular Narratives
IN


Investingwilly on Mastercard ·
Mastercard: The Best Dividend Stock You're Ignoring
Fair Value:US$75030.3% undervalued
80 followersusers have followed this narrative
1 commentusers have commented on this narrative
9 likesusers have liked this narrative
HA


HarishPK on Adobe ·
Adobe: A Probabilistic Case for Undervaluation
Fair Value:US$319.9634.1% undervalued
62 followersusers have followed this narrative
9 commentsusers have commented on this narrative
19 likesusers have liked this narrative
MA


martinarauz on Nu Holdings ·
Investment Analysis (May 2026)
Fair Value:US$22.7441.1% undervalued
68 followersusers have followed this narrative
0 commentsusers have commented on this narrative
17 likesusers have liked this narrative