- United States
- /
- Tech Hardware
- /
- NasdaqGS:STX
Seagate Technology Holdings plc's (NASDAQ:STX) Intrinsic Value Is Potentially 25% Below Its Share Price

Key Insights
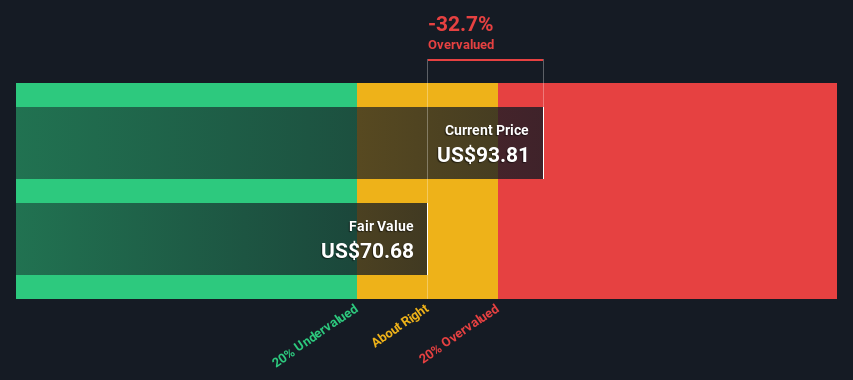
- The projected fair value for Seagate Technology Holdings is US$70.68 based on 2 Stage Free Cash Flow to Equity
- Current share price of US$93.81 suggests Seagate Technology Holdings is potentially 33% overvalued
- Our fair value estimate is 20% lower than Seagate Technology Holdings' analyst price target of US$88.05
Today we'll do a simple run through of a valuation method used to estimate the attractiveness of Seagate Technology Holdings plc (NASDAQ:STX) as an investment opportunity by projecting its future cash flows and then discounting them to today's value. We will use the Discounted Cash Flow (DCF) model on this occasion. There's really not all that much to it, even though it might appear quite complex.
Companies can be valued in a lot of ways, so we would point out that a DCF is not perfect for every situation. If you still have some burning questions about this type of valuation, take a look at the Simply Wall St analysis model.
See our latest analysis for Seagate Technology Holdings
What's The Estimated Valuation?
We're using the 2-stage growth model, which simply means we take in account two stages of company's growth. In the initial period the company may have a higher growth rate and the second stage is usually assumed to have a stable growth rate. To start off with, we need to estimate the next ten years of cash flows. Where possible we use analyst estimates, but when these aren't available we extrapolate the previous free cash flow (FCF) from the last estimate or reported value. We assume companies with shrinking free cash flow will slow their rate of shrinkage, and that companies with growing free cash flow will see their growth rate slow, over this period. We do this to reflect that growth tends to slow more in the early years than it does in later years.
Generally we assume that a dollar today is more valuable than a dollar in the future, and so the sum of these future cash flows is then discounted to today's value:
10-year free cash flow (FCF) forecast
| 2024 | 2025 | 2026 | 2027 | 2028 | 2029 | 2030 | 2031 | 2032 | 2033 | |
| Levered FCF ($, Millions) | US$296.0m | US$920.0m | US$1.11b | US$1.44b | US$1.41b | US$1.40b | US$1.40b | US$1.41b | US$1.42b | US$1.45b |
| Growth Rate Estimate Source | Analyst x9 | Analyst x9 | Analyst x3 | Analyst x1 | Analyst x1 | Est @ -0.89% | Est @ 0.06% | Est @ 0.73% | Est @ 1.20% | Est @ 1.53% |
| Present Value ($, Millions) Discounted @ 9.8% | US$270 | US$763 | US$841 | US$992 | US$882 | US$796 | US$725 | US$665 | US$613 | US$566 |
("Est" = FCF growth rate estimated by Simply Wall St)
Present Value of 10-year Cash Flow (PVCF) = US$7.1b
We now need to calculate the Terminal Value, which accounts for all the future cash flows after this ten year period. For a number of reasons a very conservative growth rate is used that cannot exceed that of a country's GDP growth. In this case we have used the 5-year average of the 10-year government bond yield (2.3%) to estimate future growth. In the same way as with the 10-year 'growth' period, we discount future cash flows to today's value, using a cost of equity of 9.8%.
Terminal Value (TV)= FCF2033 × (1 + g) ÷ (r – g) = US$1.4b× (1 + 2.3%) ÷ (9.8%– 2.3%) = US$20b
Present Value of Terminal Value (PVTV)= TV / (1 + r)10= US$20b÷ ( 1 + 9.8%)10= US$7.7b
The total value, or equity value, is then the sum of the present value of the future cash flows, which in this case is US$15b. To get the intrinsic value per share, we divide this by the total number of shares outstanding. Compared to the current share price of US$93.8, the company appears reasonably expensive at the time of writing. The assumptions in any calculation have a big impact on the valuation, so it is better to view this as a rough estimate, not precise down to the last cent.
Important Assumptions
We would point out that the most important inputs to a discounted cash flow are the discount rate and of course the actual cash flows. You don't have to agree with these inputs, I recommend redoing the calculations yourself and playing with them. The DCF also does not consider the possible cyclicality of an industry, or a company's future capital requirements, so it does not give a full picture of a company's potential performance. Given that we are looking at Seagate Technology Holdings as potential shareholders, the cost of equity is used as the discount rate, rather than the cost of capital (or weighted average cost of capital, WACC) which accounts for debt. In this calculation we've used 9.8%, which is based on a levered beta of 1.374. Beta is a measure of a stock's volatility, compared to the market as a whole. We get our beta from the industry average beta of globally comparable companies, with an imposed limit between 0.8 and 2.0, which is a reasonable range for a stable business.
SWOT Analysis for Seagate Technology Holdings
- No major strengths identified for STX.
- Interest payments on debt are not well covered.
- Dividend is low compared to the top 25% of dividend payers in the Tech market.
- Expensive based on P/S ratio and estimated fair value.
- Expected to breakeven next year.
- Has sufficient cash runway for more than 3 years based on current free cash flows.
- Debt is not well covered by operating cash flow.
- Total liabilities exceed total assets, which raises the risk of financial distress.
- Dividends are not covered by cash flow.
Next Steps:
Whilst important, the DCF calculation shouldn't be the only metric you look at when researching a company. It's not possible to obtain a foolproof valuation with a DCF model. Rather it should be seen as a guide to "what assumptions need to be true for this stock to be under/overvalued?" If a company grows at a different rate, or if its cost of equity or risk free rate changes sharply, the output can look very different. What is the reason for the share price exceeding the intrinsic value? For Seagate Technology Holdings, we've put together three essential elements you should further research:
- Risks: For example, we've discovered 3 warning signs for Seagate Technology Holdings that you should be aware of before investing here.
- Future Earnings: How does STX's growth rate compare to its peers and the wider market? Dig deeper into the analyst consensus number for the upcoming years by interacting with our free analyst growth expectation chart.
- Other High Quality Alternatives: Do you like a good all-rounder? Explore our interactive list of high quality stocks to get an idea of what else is out there you may be missing!
PS. Simply Wall St updates its DCF calculation for every American stock every day, so if you want to find the intrinsic value of any other stock just search here.
New: Manage All Your Stock Portfolios in One Place
We've created the ultimate portfolio companion for stock investors, and it's free.
• Connect an unlimited number of Portfolios and see your total in one currency
• Be alerted to new Warning Signs or Risks via email or mobile
• Track the Fair Value of your stocks
Have feedback on this article? Concerned about the content? Get in touch with us directly. Alternatively, email editorial-team (at) simplywallst.com.
This article by Simply Wall St is general in nature. We provide commentary based on historical data and analyst forecasts only using an unbiased methodology and our articles are not intended to be financial advice. It does not constitute a recommendation to buy or sell any stock, and does not take account of your objectives, or your financial situation. We aim to bring you long-term focused analysis driven by fundamental data. Note that our analysis may not factor in the latest price-sensitive company announcements or qualitative material. Simply Wall St has no position in any stocks mentioned.
About NasdaqGS:STX
Seagate Technology Holdings
Engages in the provision of data storage technology and infrastructure solutions in Singapore, the United States, the Netherlands, and internationally.
Established dividend payer and good value.
Similar Companies
Market Insights

Community Narratives
