Advertisement
- United States
- /
- Tech Hardware
- /
- NasdaqCM:OSS
One Stop Systems, Inc.'s (NASDAQ:OSS) Intrinsic Value Is Potentially 73% Above Its Share Price
Key Insights
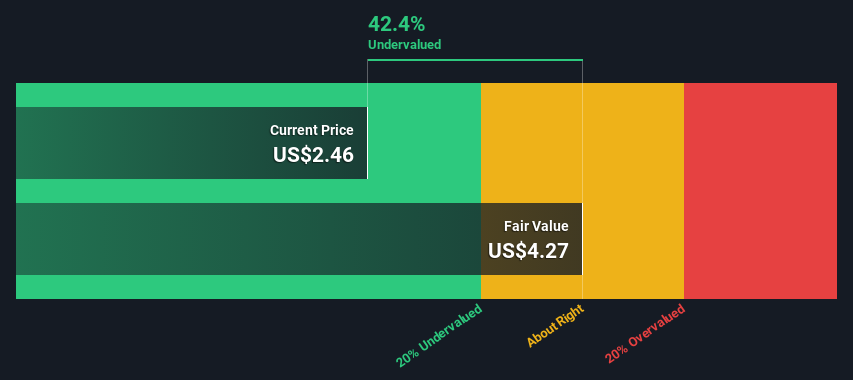
- The projected fair value for One Stop Systems is US$4.27 based on 2 Stage Free Cash Flow to Equity
- Current share price of US$2.46 suggests One Stop Systems is potentially 42% undervalued
- Our fair value estimate is 9.0% higher than One Stop Systems' analyst price target of US$3.92
Today we'll do a simple run through of a valuation method used to estimate the attractiveness of One Stop Systems, Inc. (NASDAQ:OSS) as an investment opportunity by estimating the company's future cash flows and discounting them to their present value. We will use the Discounted Cash Flow (DCF) model on this occasion. Models like these may appear beyond the comprehension of a lay person, but they're fairly easy to follow.
Companies can be valued in a lot of ways, so we would point out that a DCF is not perfect for every situation. If you want to learn more about discounted cash flow, the rationale behind this calculation can be read in detail in the Simply Wall St analysis model.
View our latest analysis for One Stop Systems
Crunching The Numbers
We use what is known as a 2-stage model, which simply means we have two different periods of growth rates for the company's cash flows. Generally the first stage is higher growth, and the second stage is a lower growth phase. In the first stage we need to estimate the cash flows to the business over the next ten years. Seeing as no analyst estimates of free cash flow are available to us, we have extrapolate the previous free cash flow (FCF) from the company's last reported value. We assume companies with shrinking free cash flow will slow their rate of shrinkage, and that companies with growing free cash flow will see their growth rate slow, over this period. We do this to reflect that growth tends to slow more in the early years than it does in later years.
Generally we assume that a dollar today is more valuable than a dollar in the future, so we discount the value of these future cash flows to their estimated value in today's dollars:
10-year free cash flow (FCF) forecast
| 2025 | 2026 | 2027 | 2028 | 2029 | 2030 | 2031 | 2032 | 2033 | 2034 | |
| Levered FCF ($, Millions) | US$1.66m | US$2.41m | US$3.20m | US$3.96m | US$4.64m | US$5.23m | US$5.74m | US$6.17m | US$6.53m | US$6.85m |
| Growth Rate Estimate Source | Est @ 64.26% | Est @ 45.70% | Est @ 32.70% | Est @ 23.61% | Est @ 17.24% | Est @ 12.78% | Est @ 9.66% | Est @ 7.48% | Est @ 5.95% | Est @ 4.88% |
| Present Value ($, Millions) Discounted @ 7.8% | US$1.5 | US$2.1 | US$2.6 | US$2.9 | US$3.2 | US$3.3 | US$3.4 | US$3.4 | US$3.3 | US$3.2 |
("Est" = FCF growth rate estimated by Simply Wall St)
Present Value of 10-year Cash Flow (PVCF) = US$29m
We now need to calculate the Terminal Value, which accounts for all the future cash flows after this ten year period. For a number of reasons a very conservative growth rate is used that cannot exceed that of a country's GDP growth. In this case we have used the 5-year average of the 10-year government bond yield (2.4%) to estimate future growth. In the same way as with the 10-year 'growth' period, we discount future cash flows to today's value, using a cost of equity of 7.8%.
Terminal Value (TV)= FCF2034 × (1 + g) ÷ (r – g) = US$6.9m× (1 + 2.4%) ÷ (7.8%– 2.4%) = US$128m
Present Value of Terminal Value (PVTV)= TV / (1 + r)10= US$128m÷ ( 1 + 7.8%)10= US$60m
The total value, or equity value, is then the sum of the present value of the future cash flows, which in this case is US$89m. The last step is to then divide the equity value by the number of shares outstanding. Relative to the current share price of US$2.5, the company appears quite good value at a 42% discount to where the stock price trades currently. The assumptions in any calculation have a big impact on the valuation, so it is better to view this as a rough estimate, not precise down to the last cent.
Important Assumptions
Now the most important inputs to a discounted cash flow are the discount rate, and of course, the actual cash flows. Part of investing is coming up with your own evaluation of a company's future performance, so try the calculation yourself and check your own assumptions. The DCF also does not consider the possible cyclicality of an industry, or a company's future capital requirements, so it does not give a full picture of a company's potential performance. Given that we are looking at One Stop Systems as potential shareholders, the cost of equity is used as the discount rate, rather than the cost of capital (or weighted average cost of capital, WACC) which accounts for debt. In this calculation we've used 7.8%, which is based on a levered beta of 1.187. Beta is a measure of a stock's volatility, compared to the market as a whole. We get our beta from the industry average beta of globally comparable companies, with an imposed limit between 0.8 and 2.0, which is a reasonable range for a stable business.
SWOT Analysis for One Stop Systems
Strength
- Debt is not viewed as a risk.
Weakness
- Shareholders have been diluted in the past year.
Opportunity
- Forecast to reduce losses next year.
- Has sufficient cash runway for more than 3 years based on current free cash flows.
- Trading below our estimate of fair value by more than 20%.
Threat
- Not expected to become profitable over the next 3 years.
Next Steps:
Although the valuation of a company is important, it is only one of many factors that you need to assess for a company. DCF models are not the be-all and end-all of investment valuation. Instead the best use for a DCF model is to test certain assumptions and theories to see if they would lead to the company being undervalued or overvalued. For example, changes in the company's cost of equity or the risk free rate can significantly impact the valuation. What is the reason for the share price sitting below the intrinsic value? For One Stop Systems, we've compiled three fundamental aspects you should assess:
- Risks: We feel that you should assess the 4 warning signs for One Stop Systems we've flagged before making an investment in the company.
- Future Earnings: How does OSS's growth rate compare to its peers and the wider market? Dig deeper into the analyst consensus number for the upcoming years by interacting with our free analyst growth expectation chart.
- Other High Quality Alternatives: Do you like a good all-rounder? Explore our interactive list of high quality stocks to get an idea of what else is out there you may be missing!
PS. The Simply Wall St app conducts a discounted cash flow valuation for every stock on the NASDAQCM every day. If you want to find the calculation for other stocks just search here.
New: AI Stock Screener & Alerts
Our new AI Stock Screener scans the market every day to uncover opportunities.
• Dividend Powerhouses (3%+ Yield)
• Undervalued Small Caps with Insider Buying
• High growth Tech and AI Companies
Or build your own from over 50 metrics.
Have feedback on this article? Concerned about the content? Get in touch with us directly. Alternatively, email editorial-team (at) simplywallst.com.
This article by Simply Wall St is general in nature. We provide commentary based on historical data and analyst forecasts only using an unbiased methodology and our articles are not intended to be financial advice. It does not constitute a recommendation to buy or sell any stock, and does not take account of your objectives, or your financial situation. We aim to bring you long-term focused analysis driven by fundamental data. Note that our analysis may not factor in the latest price-sensitive company announcements or qualitative material. Simply Wall St has no position in any stocks mentioned.
Have feedback on this article? Concerned about the content? Get in touch with us directly. Alternatively, email editorial-team@simplywallst.com
About NasdaqCM:OSS
One Stop Systems
Designs, manufactures, and markets rugged high-performance compute, high speed switch fabrics, and storage systems for edge applications of artificial intelligence and machine learning, sensor processing, sensor fusion, and autonomy in the United States and internationally.
Flawless balance sheet with low risk.
Similar Companies
Market Insights


Advertisement
Weekly Picks
CE


Ceazar on Sparc AI ·
When GPS fails: this small cap is fixing a $54B drone problem
Fair Value:CA$5.2540.2% undervalued
93 followersusers have followed this narrative
0 commentsusers have commented on this narrative
23 likesusers have liked this narrative
HE


HedgeY on IonQ ·
The Best-Funded Quantum Platform and Still a Stock Priced for Perfection
Fair Value:US$481.8% overvalued
33 followersusers have followed this narrative
0 commentsusers have commented on this narrative
9 likesusers have liked this narrative
BL


BlackGoat on Cerebras Systems ·
The Wafer Giant Threatening NVIDIA's GPU Hegemony
Fair Value:US$415.5453.8% undervalued
58 followersusers have followed this narrative
1 commentusers have commented on this narrative
10 likesusers have liked this narrative
IV

Ivoed on Netflix ·
Netflix’s Business Quality Is Clear. The Harder Question Is Whether The Stock Is Still Cheap
Fair Value:US$827.3% undervalued
29 followersusers have followed this narrative
2 commentsusers have commented on this narrative
10 likesusers have liked this narrative
Recently Updated Narratives
DA


DaneDruss on Cloudflare ·
Q-Day: Quantum Hype vs Quantum-Safe Infrastructure
Fair Value:US$167.4547.8% overvalued
1 followerusers have followed this narrative
0 commentsusers have commented on this narrative
0 likesusers have liked this narrative
BU


Bullish4YaMotha on Celsius Holdings ·
Celsius Holdings ($CELH): $33.04 – Swing Trading Timeframe: 1–2 Months. Score: 8.8/10
Fair Value:US$47.3730.3% undervalued
1 followerusers have followed this narrative
0 commentsusers have commented on this narrative
0 likesusers have liked this narrative
WE


WealthAP on Alphabet ·
The "Easy Money" Is Gone: Why Alphabet Is Now a "Show Me" Story
Fair Value:US$386.435.2% undervalued
71 followersusers have followed this narrative
1 commentusers have commented on this narrative
0 likesusers have liked this narrative
Popular Narratives
IN


Investingwilly on Mastercard ·
Mastercard: The Best Dividend Stock You're Ignoring
Fair Value:US$75028.9% undervalued
84 followersusers have followed this narrative
1 commentusers have commented on this narrative
9 likesusers have liked this narrative
HA


HarishPK on Adobe ·
Adobe: A Probabilistic Case for Undervaluation
Fair Value:US$319.9631.8% undervalued
64 followersusers have followed this narrative
9 commentsusers have commented on this narrative
19 likesusers have liked this narrative
BL
BlackGoat on Cerebras Systems ·
The Wafer Giant Threatening NVIDIA's GPU Hegemony
Fair Value:US$415.5453.8% undervalued
58 followersusers have followed this narrative
1 commentusers have commented on this narrative
10 likesusers have liked this narrative
Trending Discussion


MW

mwod31 on Greatland Resources ·
A great comment, WSB have not done the research imo. I intend to buy more shares in 2026.
0
|0