
Advertisement
- United States
- /
- Machinery
- /
- NasdaqCM:NNDM
We're Not Very Worried About Nano Dimension's (NASDAQ:NNDM) Cash Burn Rate
Even when a business is losing money, it's possible for shareholders to make money if they buy a good business at the right price. For example, although software-as-a-service business Salesforce.com lost money for years while it grew recurring revenue, if you held shares since 2005, you'd have done very well indeed. But while history lauds those rare successes, those that fail are often forgotten; who remembers Pets.com?
Given this risk, we thought we'd take a look at whether Nano Dimension (NASDAQ:NNDM) shareholders should be worried about its cash burn. In this article, we define cash burn as its annual (negative) free cash flow, which is the amount of money a company spends each year to fund its growth. The first step is to compare its cash burn with its cash reserves, to give us its 'cash runway'.
View our latest analysis for Nano Dimension
How Long Is Nano Dimension's Cash Runway?
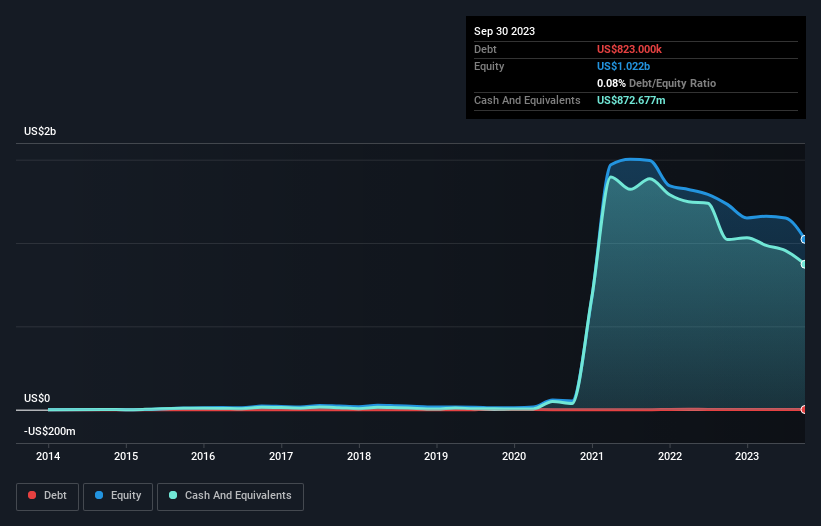
A company's cash runway is the amount of time it would take to burn through its cash reserves at its current cash burn rate. Nano Dimension has such a small amount of debt that we'll set it aside, and focus on the US$873m in cash it held at September 2023. Importantly, its cash burn was US$116m over the trailing twelve months. Therefore, from September 2023 it had 7.5 years of cash runway. While this is only one measure of its cash burn situation, it certainly gives us the impression that holders have nothing to worry about. You can see how its cash balance has changed over time in the image below.
How Well Is Nano Dimension Growing?
Some investors might find it troubling that Nano Dimension is actually increasing its cash burn, which is up 23% in the last year. The good news is that operating revenue increased by 38% in the last year, indicating that the business is gaining some traction. On balance, we'd say the company is improving over time. In reality, this article only makes a short study of the company's growth data. This graph of historic revenue growth shows how Nano Dimension is building its business over time.
How Easily Can Nano Dimension Raise Cash?
While Nano Dimension seems to be in a decent position, we reckon it is still worth thinking about how easily it could raise more cash, if that proved desirable. Companies can raise capital through either debt or equity. Commonly, a business will sell new shares in itself to raise cash and drive growth. By comparing a company's annual cash burn to its total market capitalisation, we can estimate roughly how many shares it would have to issue in order to run the company for another year (at the same burn rate).
Nano Dimension's cash burn of US$116m is about 18% of its US$639m market capitalisation. As a result, we'd venture that the company could raise more cash for growth without much trouble, albeit at the cost of some dilution.
Is Nano Dimension's Cash Burn A Worry?
On this analysis of Nano Dimension's cash burn, we think its cash runway was reassuring, while its increasing cash burn has us a bit worried. Considering all the factors discussed in this article, we're not overly concerned about the company's cash burn, although we do think shareholders should keep an eye on how it develops. Readers need to have a sound understanding of business risks before investing in a stock, and we've spotted 1 warning sign for Nano Dimension that potential shareholders should take into account before putting money into a stock.
Of course, you might find a fantastic investment by looking elsewhere. So take a peek at this free list of companies insiders are buying, and this list of stocks growth stocks (according to analyst forecasts)
Valuation is complex, but we're here to simplify it.
Discover if Nano Dimension might be undervalued or overvalued with our detailed analysis, featuring fair value estimates, potential risks, dividends, insider trades, and its financial condition.
Access Free AnalysisHave feedback on this article? Concerned about the content? Get in touch with us directly. Alternatively, email editorial-team (at) simplywallst.com.
This article by Simply Wall St is general in nature. We provide commentary based on historical data and analyst forecasts only using an unbiased methodology and our articles are not intended to be financial advice. It does not constitute a recommendation to buy or sell any stock, and does not take account of your objectives, or your financial situation. We aim to bring you long-term focused analysis driven by fundamental data. Note that our analysis may not factor in the latest price-sensitive company announcements or qualitative material. Simply Wall St has no position in any stocks mentioned.
About NasdaqCM:NNDM
Nano Dimension
Provides industrial manufacturing solutions for design-to-manufacturing of electronics and mechanical parts in the Americas, the Asia Pacific, Europe, the Middle East, and Africa.
Excellent balance sheet with minimal risk.
Market Insights

Advertisement
Community Narratives
MicroVision will explode future revenue by 380.37% with a vision towards success
Fair Value US$60|98.4% undervalued
TH
Community Contributor
The Indispensable Artery for a New North American Economy
Fair Value CA$132.87|0.8% undervalued
TI
Community Contributor
Recently Updated Narratives
CO

composite32 on TAV Havalimanlari Holding ·
TAV Havalimanlari Holding will fly high with 25.68% revenue growth
Fair Value:₺545.1648.6% undervalued
3 followersusers have followed this narrative
0 commentsusers have commented on this narrative
0 likesusers have liked this narrative
RO


Robbo on Fiducian Group ·
Fiducian: Compliance Clouds or Value Opportunity?
Fair Value:AU$122.3% overvalued
1 followerusers have followed this narrative
0 commentsusers have commented on this narrative
0 likesusers have liked this narrative
MA


MarkoVT on COVER ·
Q3 Outlook modestly optimistic
Fair Value:JP¥1.65k2.0% overvalued
1 followerusers have followed this narrative
0 commentsusers have commented on this narrative
0 likesusers have liked this narrative
Popular Narratives
TH

TheWallstreetKing on MicroVision ·
MicroVision will explode future revenue by 380.37% with a vision towards success
Fair Value:US$6098.4% undervalued
93 followersusers have followed this narrative
10 commentsusers have commented on this narrative
18 likesusers have liked this narrative
OS


oscargarcia on Alphabet ·
The company that turned a verb into a global necessity and basically runs the modern internet, digital ads, smartphones, maps, and AI.
Fair Value:US$3405.9% undervalued
136 followersusers have followed this narrative
6 commentsusers have commented on this narrative
18 likesusers have liked this narrative
AN


AnalystConsensusTarget on NVIDIA ·
NVDA: Expanding AI Demand Will Drive Major Data Center Investments Through 2026
Fair Value:US$232.7922.6% undervalued
929 followersusers have followed this narrative
6 commentsusers have commented on this narrative
22 likesusers have liked this narrative