- United States
- /
- Tech Hardware
- /
- NasdaqGS:IMMR
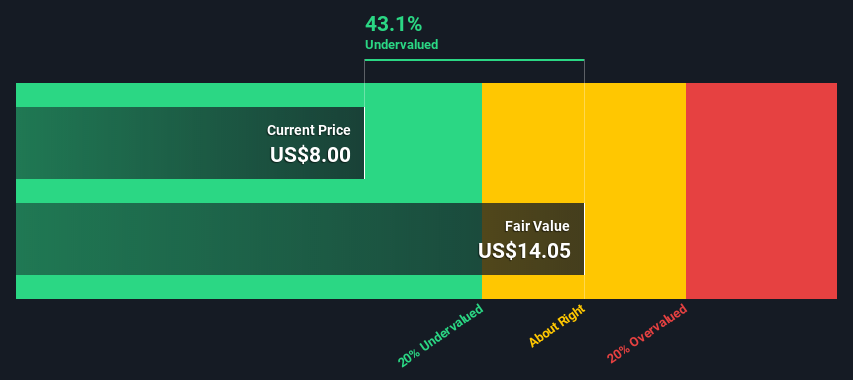
An Intrinsic Calculation For Immersion Corporation (NASDAQ:IMMR) Suggests It's 43% Undervalued

In this article we are going to estimate the intrinsic value of Immersion Corporation (NASDAQ:IMMR) by projecting its future cash flows and then discounting them to today's value. Our analysis will employ the Discounted Cash Flow (DCF) model. Before you think you won't be able to understand it, just read on! It's actually much less complex than you'd imagine.
Remember though, that there are many ways to estimate a company's value, and a DCF is just one method. Anyone interested in learning a bit more about intrinsic value should have a read of the Simply Wall St analysis model.
See our latest analysis for Immersion
The calculation
We use what is known as a 2-stage model, which simply means we have two different periods of growth rates for the company's cash flows. Generally the first stage is higher growth, and the second stage is a lower growth phase. To begin with, we have to get estimates of the next ten years of cash flows. Seeing as no analyst estimates of free cash flow are available to us, we have extrapolate the previous free cash flow (FCF) from the company's last reported value. We assume companies with shrinking free cash flow will slow their rate of shrinkage, and that companies with growing free cash flow will see their growth rate slow, over this period. We do this to reflect that growth tends to slow more in the early years than it does in later years.
A DCF is all about the idea that a dollar in the future is less valuable than a dollar today, and so the sum of these future cash flows is then discounted to today's value:
10-year free cash flow (FCF) forecast
| 2021 | 2022 | 2023 | 2024 | 2025 | 2026 | 2027 | 2028 | 2029 | 2030 | |
| Levered FCF ($, Millions) | US$8.74m | US$12.1m | US$15.5m | US$18.6m | US$21.4m | US$23.7m | US$25.6m | US$27.3m | US$28.6m | US$29.8m |
| Growth Rate Estimate Source | Est @ 54.75% | Est @ 38.92% | Est @ 27.84% | Est @ 20.09% | Est @ 14.66% | Est @ 10.86% | Est @ 8.2% | Est @ 6.34% | Est @ 5.03% | Est @ 4.12% |
| Present Value ($, Millions) Discounted @ 7.1% | US$8.2 | US$10.6 | US$12.6 | US$14.1 | US$15.1 | US$15.7 | US$15.8 | US$15.7 | US$15.4 | US$15.0 |
("Est" = FCF growth rate estimated by Simply Wall St)
Present Value of 10-year Cash Flow (PVCF) = US$138m
We now need to calculate the Terminal Value, which accounts for all the future cash flows after this ten year period. The Gordon Growth formula is used to calculate Terminal Value at a future annual growth rate equal to the 5-year average of the 10-year government bond yield of 2.0%. We discount the terminal cash flows to today's value at a cost of equity of 7.1%.
Terminal Value (TV)= FCF2030 × (1 + g) ÷ (r – g) = US$30m× (1 + 2.0%) ÷ (7.1%– 2.0%) = US$590m
Present Value of Terminal Value (PVTV)= TV / (1 + r)10= US$590m÷ ( 1 + 7.1%)10= US$296m
The total value, or equity value, is then the sum of the present value of the future cash flows, which in this case is US$434m. To get the intrinsic value per share, we divide this by the total number of shares outstanding. Relative to the current share price of US$8.0, the company appears quite undervalued at a 43% discount to where the stock price trades currently. Valuations are imprecise instruments though, rather like a telescope - move a few degrees and end up in a different galaxy. Do keep this in mind.
The assumptions
The calculation above is very dependent on two assumptions. The first is the discount rate and the other is the cash flows. Part of investing is coming up with your own evaluation of a company's future performance, so try the calculation yourself and check your own assumptions. The DCF also does not consider the possible cyclicality of an industry, or a company's future capital requirements, so it does not give a full picture of a company's potential performance. Given that we are looking at Immersion as potential shareholders, the cost of equity is used as the discount rate, rather than the cost of capital (or weighted average cost of capital, WACC) which accounts for debt. In this calculation we've used 7.1%, which is based on a levered beta of 1.091. Beta is a measure of a stock's volatility, compared to the market as a whole. We get our beta from the industry average beta of globally comparable companies, with an imposed limit between 0.8 and 2.0, which is a reasonable range for a stable business.
Moving On:
Whilst important, the DCF calculation is only one of many factors that you need to assess for a company. The DCF model is not a perfect stock valuation tool. Rather it should be seen as a guide to "what assumptions need to be true for this stock to be under/overvalued?" If a company grows at a different rate, or if its cost of equity or risk free rate changes sharply, the output can look very different. Can we work out why the company is trading at a discount to intrinsic value? For Immersion, we've put together three further elements you should further examine:
- Risks: Every company has them, and we've spotted 3 warning signs for Immersion you should know about.
- Management:Have insiders been ramping up their shares to take advantage of the market's sentiment for IMMR's future outlook? Check out our management and board analysis with insights on CEO compensation and governance factors.
- Other High Quality Alternatives: Do you like a good all-rounder? Explore our interactive list of high quality stocks to get an idea of what else is out there you may be missing!
PS. Simply Wall St updates its DCF calculation for every American stock every day, so if you want to find the intrinsic value of any other stock just search here.
If you’re looking to trade Immersion, open an account with the lowest-cost* platform trusted by professionals, Interactive Brokers. Their clients from over 200 countries and territories trade stocks, options, futures, forex, bonds and funds worldwide from a single integrated account. Promoted
New: AI Stock Screener & Alerts
Our new AI Stock Screener scans the market every day to uncover opportunities.
• Dividend Powerhouses (3%+ Yield)
• Undervalued Small Caps with Insider Buying
• High growth Tech and AI Companies
Or build your own from over 50 metrics.
This article by Simply Wall St is general in nature. It does not constitute a recommendation to buy or sell any stock, and does not take account of your objectives, or your financial situation. We aim to bring you long-term focused analysis driven by fundamental data. Note that our analysis may not factor in the latest price-sensitive company announcements or qualitative material. Simply Wall St has no position in any stocks mentioned.
*Interactive Brokers Rated Lowest Cost Broker by StockBrokers.com Annual Online Review 2020
Have feedback on this article? Concerned about the content? Get in touch with us directly. Alternatively, email editorial-team (at) simplywallst.com.
About NasdaqGS:IMMR
Immersion
Engages in the creation, design, development, and licensing of haptic technologies that allow people to use their sense of touch to engage with and experience various digital products in North America, Europe, and Asia.
Adequate balance sheet and fair value.
Market Insights

Community Narratives

