- United States
- /
- Electronic Equipment and Components
- /
- NasdaqGS:FLEX
Is It Too Late to Consider Flex After Its Strong Multi Year Share Price Surge

Reviewed by Bailey Pemberton
- Wondering if Flex is still a smart buy after its big run, or if the easy money has already been made? You are not alone, and this is exactly the question we are going to unpack.
- Even after a recent 12.8% pullback over the last week, the stock is still up 7.0% in the last month, 62.7% year to date and 65.7% over the past year, with a 295.8% gain over 3 years and 373.7% over 5 years.
- Those kinds of multiyear gains have been associated with a steady repositioning of Flex as a higher value manufacturing partner in areas like cloud infrastructure, automotive and industrial solutions, which investors increasingly view as long term secular growth stories. At the same time, ongoing portfolio simplification and a sharper focus on higher margin businesses have helped reframe how the market thinks about the company and what multiple it deserves.
- On our scorecard Flex has a valuation score of 3/6, reflecting that it screens as undervalued on half of the key checks we run. Next we will look at what different valuation approaches say about the stock and, more importantly, explore a way to think about its worth by the end of this article.
Approach 1: Flex Discounted Cash Flow (DCF) Analysis
A Discounted Cash Flow, or DCF, estimates what a business is worth by projecting the cash it can generate in the future and then discounting those cash flows back to today in dollar terms.
For Flex, the model uses a 2 Stage Free Cash Flow to Equity approach, starting from last twelve months free cash flow of about $1.17 billion. Analyst and extrapolated forecasts see free cash flow rising steadily, reaching roughly $1.92 billion by 2035 as the business scales in higher value segments. Early year estimates, such as around $660 million in 2026 and $1.21 billion in 2027, are then extended by Simply Wall St to build a 10 year cash flow path.
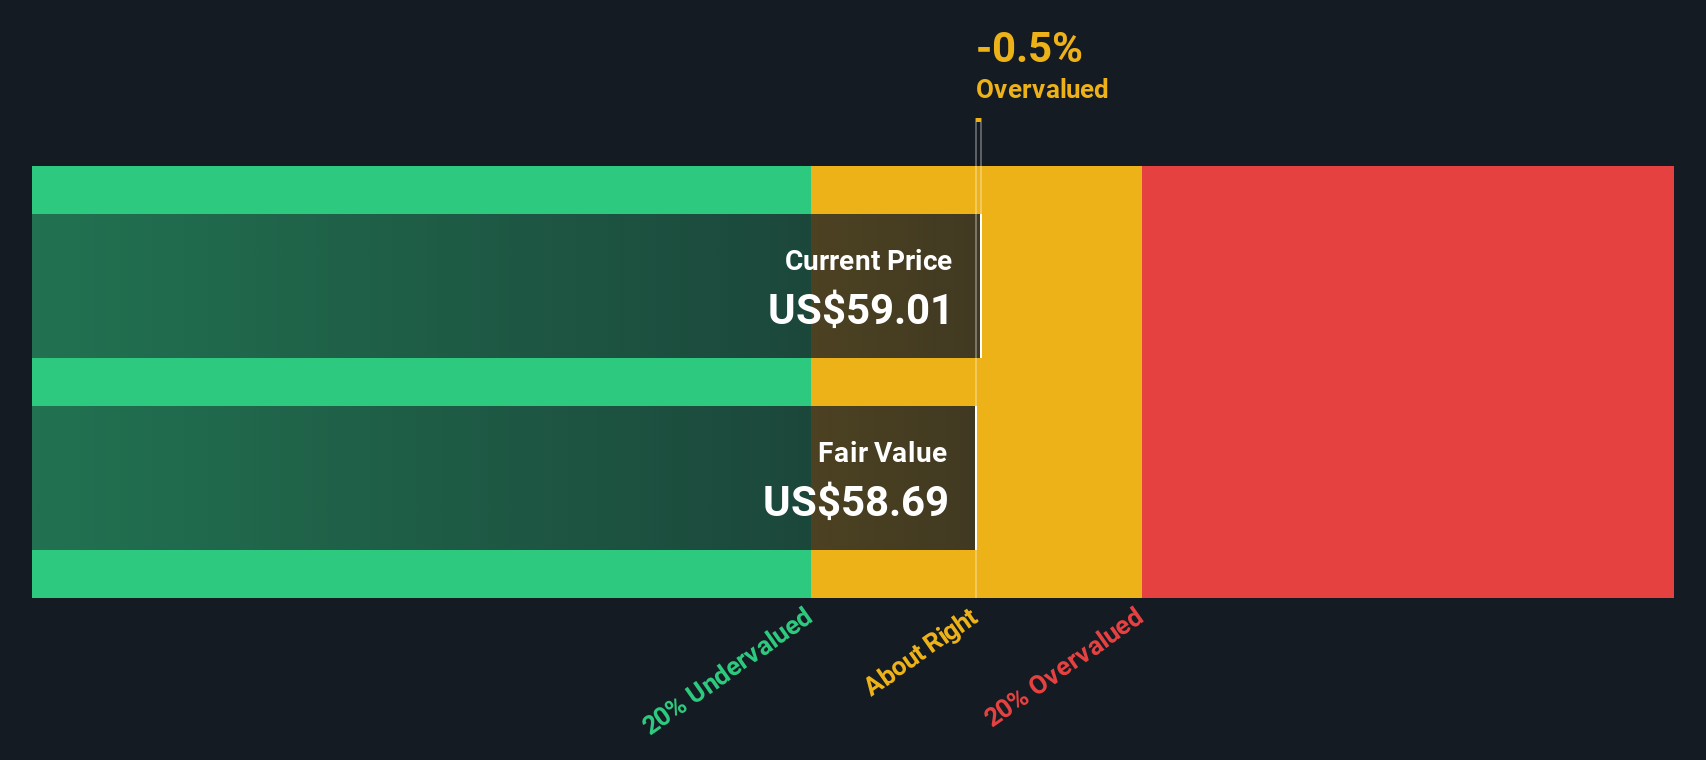
Discounting these projected cash flows back to today yields an estimated intrinsic value of $65.59 per share. Compared with the current share price, this implies Flex is trading at roughly a 4.2% discount, which indicates the stock is reasonably close to fair value with a mild margin of safety.
Result: ABOUT RIGHT
Flex is fairly valued according to our Discounted Cash Flow (DCF), but this can change at a moment's notice. Track the value in your watchlist or portfolio and be alerted on when to act.
Approach 2: Flex Price vs Earnings
For a consistently profitable company like Flex, the price to earnings (PE) ratio is a useful way to gauge what investors are willing to pay for each dollar of current earnings. In general, higher expected growth and lower perceived risk justify a higher PE, while slower growth or greater uncertainty usually call for a lower multiple.
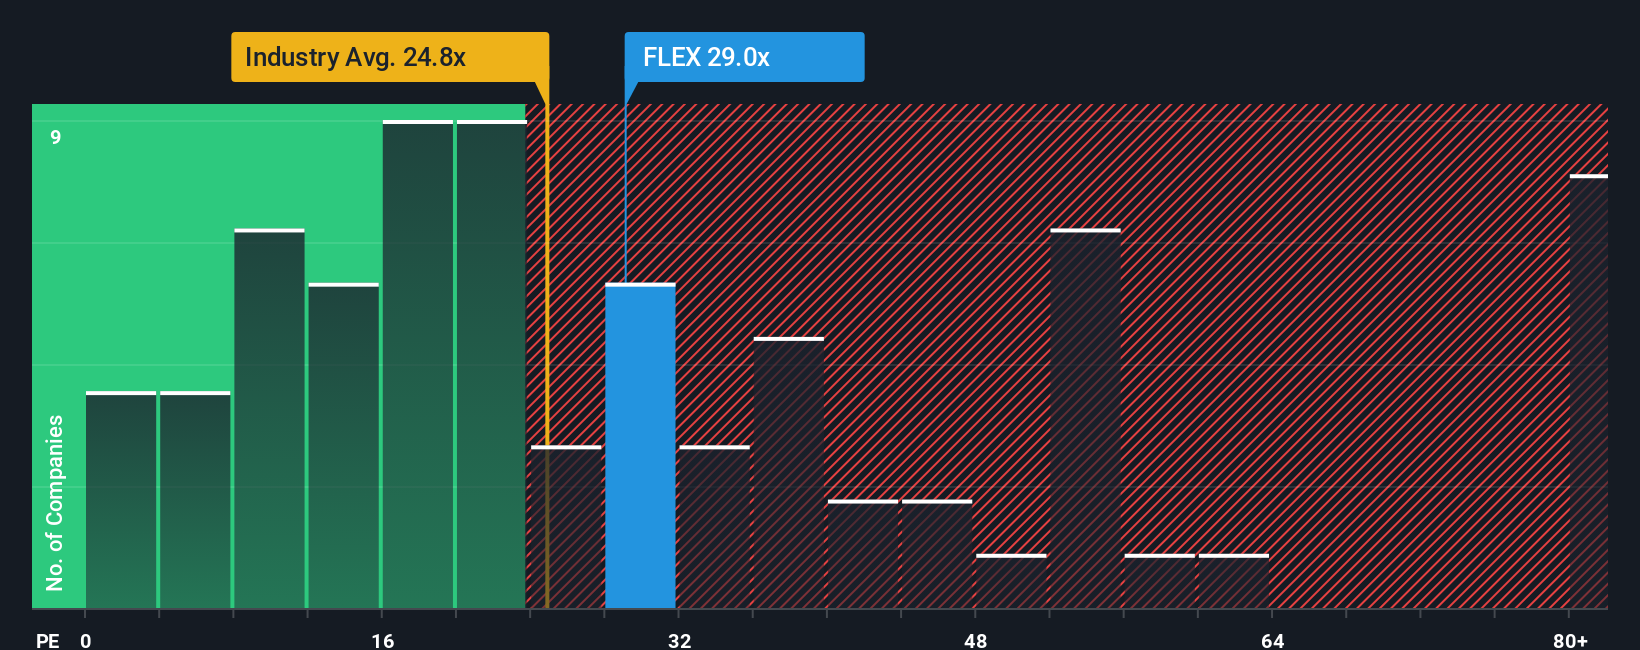
Flex currently trades on a PE of about 26.5x, which is above the broader Electronic industry average of roughly 24.3x, but still sits at a discount to the peer group average of around 36.5x. To move beyond simple comparisons, Simply Wall St also calculates a Fair Ratio, a proprietary estimate of what Flexs PE should be once its earnings growth outlook, margins, risk profile, industry, and market cap are all taken into account. In Flexs case, that Fair Ratio is 32.1x, suggesting the company arguably deserves a higher earnings multiple than the market is currently assigning.
With the Fair Ratio sitting meaningfully above the actual PE, this approach points to Flex being undervalued on a relative earnings basis.
Result: UNDERVALUED
PE ratios tell one story, but what if the real opportunity lies elsewhere? Discover 1463 companies where insiders are betting big on explosive growth.
Upgrade Your Decision Making: Choose your Flex Narrative
Earlier we mentioned that there is an even better way to understand valuation, so let us introduce you to Narratives, a simple tool on Simply Wall St’s Community page that lets you write the story behind your numbers. You can link your view of a company’s future revenues, earnings and margins to a financial forecast and resulting fair value, then continuously update that view as news or earnings arrive. This allows you to compare your Fair Value to today’s Price and decide whether you would buy or sell, whether you lean bullish like investors who see Flex’s AI data center, cloud and automotive mix as justifying a fair value closer to the top of recent analyst targets around $75, or more cautious like those who focus on customer concentration and thin margins and anchor nearer the low end around $50.
Do you think there's more to the story for Flex? Head over to our Community to see what others are saying!

This article by Simply Wall St is general in nature. We provide commentary based on historical data and analyst forecasts only using an unbiased methodology and our articles are not intended to be financial advice. It does not constitute a recommendation to buy or sell any stock, and does not take account of your objectives, or your financial situation. We aim to bring you long-term focused analysis driven by fundamental data. Note that our analysis may not factor in the latest price-sensitive company announcements or qualitative material. Simply Wall St has no position in any stocks mentioned.
Mobile Infrastructure for Defense and Disaster
The next wave in robotics isn't humanoid. Its fully autonomous towers delivering 5G, ISR, and radar in under 30 minutes, anywhere.
Get the investor briefing before the next round of contracts
Sponsored On Behalf of CiTechNew: AI Stock Screener & Alerts
Our new AI Stock Screener scans the market every day to uncover opportunities.
• Dividend Powerhouses (3%+ Yield)
• Undervalued Small Caps with Insider Buying
• High growth Tech and AI Companies
Or build your own from over 50 metrics.
Have feedback on this article? Concerned about the content? Get in touch with us directly. Alternatively, email editorial-team@simplywallst.com
About NasdaqGS:FLEX
Flex
Provides technology innovation, supply chain, and manufacturing solutions to data center, communications, enterprise, consumer, automotive, industrial, healthcare, industrial, and power industries.
Flawless balance sheet with proven track record.
Similar Companies
Market Insights

Weekly Picks

Early mover in a fast growing industry. Likely to experience share price volatility as they scale


A case for CA$31.80 (undiluted), aka 8,616% upside from CA$0.37 (an 86 bagger!).


Moderation and Stabilisation: HOLD: Fair Price based on a 4-year Cycle is $12.08
Recently Updated Narratives


Title: Market Sentiment Is Dead Wrong — Here's Why PSEC Deserves a Second Look


An amazing opportunity to potentially get a 100 bagger

Amazon: Why the World’s Biggest Platform Still Runs on Invisible Economics
Popular Narratives


MicroVision will explode future revenue by 380.37% with a vision towards success


Crazy Undervalued 42 Baggers Silver Play (Active & Running Mine)


NVDA: Expanding AI Demand Will Drive Major Data Center Investments Through 2026
Trending Discussion
