Advertisement
- United States
- /
- Electronic Equipment and Components
- /
- NasdaqGS:FLEX
Flex (NASDAQ:FLEX) Has A Somewhat Strained Balance Sheet
Warren Buffett famously said, 'Volatility is far from synonymous with risk.' When we think about how risky a company is, we always like to look at its use of debt, since debt overload can lead to ruin. Importantly, Flex Ltd. (NASDAQ:FLEX) does carry debt. But should shareholders be worried about its use of debt?
What Risk Does Debt Bring?
Debt is a tool to help businesses grow, but if a business is incapable of paying off its lenders, then it exists at their mercy. If things get really bad, the lenders can take control of the business. However, a more frequent (but still costly) occurrence is where a company must issue shares at bargain-basement prices, permanently diluting shareholders, just to shore up its balance sheet. Of course, the upside of debt is that it often represents cheap capital, especially when it replaces dilution in a company with the ability to reinvest at high rates of return. When we examine debt levels, we first consider both cash and debt levels, together.
See our latest analysis for Flex
How Much Debt Does Flex Carry?
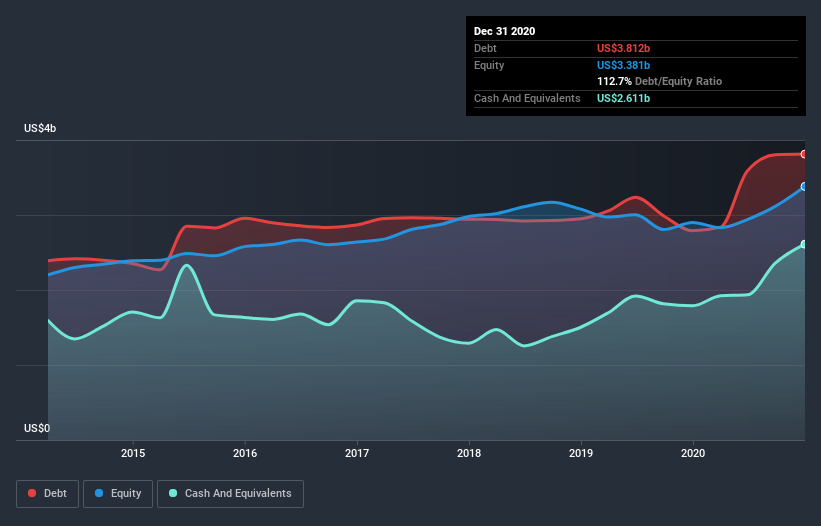
You can click the graphic below for the historical numbers, but it shows that as of December 2020 Flex had US$3.81b of debt, an increase on US$2.79b, over one year. However, because it has a cash reserve of US$2.61b, its net debt is less, at about US$1.20b.
A Look At Flex's Liabilities
We can see from the most recent balance sheet that Flex had liabilities of US$7.52b falling due within a year, and liabilities of US$4.77b due beyond that. On the other hand, it had cash of US$2.61b and US$4.19b worth of receivables due within a year. So it has liabilities totalling US$5.49b more than its cash and near-term receivables, combined.
This is a mountain of leverage relative to its market capitalization of US$8.94b. Should its lenders demand that it shore up the balance sheet, shareholders would likely face severe dilution.
We use two main ratios to inform us about debt levels relative to earnings. The first is net debt divided by earnings before interest, tax, depreciation, and amortization (EBITDA), while the second is how many times its earnings before interest and tax (EBIT) covers its interest expense (or its interest cover, for short). Thus we consider debt relative to earnings both with and without depreciation and amortization expenses.
While Flex's low debt to EBITDA ratio of 0.97 suggests only modest use of debt, the fact that EBIT only covered the interest expense by 5.8 times last year does give us pause. So we'd recommend keeping a close eye on the impact financing costs are having on the business. We note that Flex grew its EBIT by 24% in the last year, and that should make it easier to pay down debt, going forward. The balance sheet is clearly the area to focus on when you are analysing debt. But ultimately the future profitability of the business will decide if Flex can strengthen its balance sheet over time. So if you're focused on the future you can check out this free report showing analyst profit forecasts.
But our final consideration is also important, because a company cannot pay debt with paper profits; it needs cold hard cash. So we always check how much of that EBIT is translated into free cash flow. During the last three years, Flex burned a lot of cash. While that may be a result of expenditure for growth, it does make the debt far more risky.
Our View
Flex's conversion of EBIT to free cash flow was a real negative on this analysis, although the other factors we considered cast it in a significantly better light. For example its EBIT growth rate was refreshing. Looking at all the angles mentioned above, it does seem to us that Flex is a somewhat risky investment as a result of its debt. That's not necessarily a bad thing, since leverage can boost returns on equity, but it is something to be aware of. There's no doubt that we learn most about debt from the balance sheet. But ultimately, every company can contain risks that exist outside of the balance sheet. Be aware that Flex is showing 3 warning signs in our investment analysis , and 1 of those makes us a bit uncomfortable...
If you're interested in investing in businesses that can grow profits without the burden of debt, then check out this free list of growing businesses that have net cash on the balance sheet.
If you decide to trade Flex, use the lowest-cost* platform that is rated #1 Overall by Barron’s, Interactive Brokers. Trade stocks, options, futures, forex, bonds and funds on 135 markets, all from a single integrated account. Promoted
New: AI Stock Screener & Alerts
Our new AI Stock Screener scans the market every day to uncover opportunities.
• Dividend Powerhouses (3%+ Yield)
• Undervalued Small Caps with Insider Buying
• High growth Tech and AI Companies
Or build your own from over 50 metrics.
This article by Simply Wall St is general in nature. It does not constitute a recommendation to buy or sell any stock, and does not take account of your objectives, or your financial situation. We aim to bring you long-term focused analysis driven by fundamental data. Note that our analysis may not factor in the latest price-sensitive company announcements or qualitative material. Simply Wall St has no position in any stocks mentioned.
*Interactive Brokers Rated Lowest Cost Broker by StockBrokers.com Annual Online Review 2020
Have feedback on this article? Concerned about the content? Get in touch with us directly. Alternatively, email editorial-team (at) simplywallst.com.
About NasdaqGS:FLEX
Flex
Provides technology innovation, supply chain, and manufacturing solutions to data center, communications, enterprise, consumer, automotive, healthcare, industrial, and power industries in the Americas, Asia, and Europe.
Exceptional growth potential with excellent balance sheet.
Similar Companies
Market Insights


Advertisement
Weekly Picks
CE


Ceazar on Sparc AI ·
When GPS fails: this small cap is fixing a $54B drone problem
Fair Value:CA$5.2550.7% undervalued
117 followersusers have followed this narrative
0 commentsusers have commented on this narrative
25 likesusers have liked this narrative
BL


BlackGoat on IREN ·
IREN's Bold Moves in Sustainable Bitcoin Mining & AI Data Centers
Fair Value:US$71.4846.5% undervalued
219 followersusers have followed this narrative
9 commentsusers have commented on this narrative
33 likesusers have liked this narrative
HE


HedgeY on Arm Holdings ·
The Architecture Layer of AI Computing - But Priced Like the Future Already Arrived?
Fair Value:US$43043.8% undervalued
22 followersusers have followed this narrative
1 commentusers have commented on this narrative
6 likesusers have liked this narrative
HI


Hidden_Rock_Capital on Fiserv ·
Temporary "perfect storm" leads to opportunity to buy financial services leader for less than 5x long-term earnings
Fair Value:US$119.9954.9% undervalued
30 followersusers have followed this narrative
1 commentusers have commented on this narrative
10 likesusers have liked this narrative
Recently Updated Narratives
KA


Kaiserhenry on Nigerian Exchange Group ·
Future Growth Awaits NGXGROUP with New High-Profile Listings
Fair Value:₦187.525.4% undervalued
7 followersusers have followed this narrative
0 commentsusers have commented on this narrative
0 likesusers have liked this narrative
JO


John_Eric on Meta Platforms ·
META: The Tide Just Went Out. Let's See Who's Dressed.
Fair Value:US$778.9330.8% undervalued
1 followerusers have followed this narrative
0 commentsusers have commented on this narrative
0 likesusers have liked this narrative
JO

John_Eric on Microsoft ·
Microsoft (MSFT): The AI Bull Case Everyone Sees, Trading at a Multiple Nobody's Willing to Pay
Fair Value:US$60024.8% undervalued
31 followersusers have followed this narrative
0 commentsusers have commented on this narrative
0 likesusers have liked this narrative
Popular Narratives
OS


oscargarcia on NVIDIA ·
The company that went from selling GPUs to gamers to becoming the AI arms dealer of the 21st century.
Fair Value:US$28030.3% undervalued
217 followersusers have followed this narrative
9 commentsusers have commented on this narrative
15 likesusers have liked this narrative
CU
CubanEros on Microsoft ·
A wonderful business at reasonable price.
Fair Value:US$419.917.4% overvalued
100 followersusers have followed this narrative
0 commentsusers have commented on this narrative
7 likesusers have liked this narrative
BE

benjamin_lvieq on PayPal Holdings ·
PayPal: PayPal Doesn't Need to Grow – It Needs to Stop Falling – A Mispriced Cash Machine With a Cannibal Buyback
Fair Value:US$6511.3% undervalued
75 followersusers have followed this narrative
2 commentsusers have commented on this narrative
11 likesusers have liked this narrative
Trending Discussion
GR
greg_xasak on Fiserv ·
As someone who has dealt directly with them as a CTO for a credit union, I have 8 years of horror stories about doing business with them. If there was any other competitor than could deliver 80% of Fiserv services, there would be a mad rush to migrate to them. They should thank their lucky stars they are a near monopoly. this industry is so ripe for a well funded competitor. Their integration of technology is awful, their ability to fix their own implementation screwups is sadly tragic. Sometimes they just silently kill support tickets without resolution and you never find out until you do a follow up inquiry. Why, because sometimes no one you are dealing with knows how to fix it and knows no one to ask for help. They can not meet their own implementation deadlines and sometimes there is no one on a technical team dealing with you that has any banking or credit union experience. The is an industry insider phrase when you meet other Fiserv customers called being "Fiserved". It means telling others of your worst stories of dealing with them. Ask around, all CTO's have some doozies.
1
|0

BL

Blegells on Terra Balcanica Resources ·
⏫42X THE AVERAGE DAILY TRADING VOLUME TODAY, JULY 28 🐂🐂🐂 FORTY-TWO!
1
|0