Advertisement
- United States
- /
- Electronic Equipment and Components
- /
- NasdaqGS:FLEX
Flex (NASDAQ:FLEX) Has A Pretty Healthy Balance Sheet
The external fund manager backed by Berkshire Hathaway's Charlie Munger, Li Lu, makes no bones about it when he says 'The biggest investment risk is not the volatility of prices, but whether you will suffer a permanent loss of capital.' It's only natural to consider a company's balance sheet when you examine how risky it is, since debt is often involved when a business collapses. As with many other companies Flex Ltd. (NASDAQ:FLEX) makes use of debt. But the more important question is: how much risk is that debt creating?
When Is Debt Dangerous?
Debt is a tool to help businesses grow, but if a business is incapable of paying off its lenders, then it exists at their mercy. If things get really bad, the lenders can take control of the business. However, a more common (but still painful) scenario is that it has to raise new equity capital at a low price, thus permanently diluting shareholders. Having said that, the most common situation is where a company manages its debt reasonably well - and to its own advantage. The first step when considering a company's debt levels is to consider its cash and debt together.
Check out our latest analysis for Flex
What Is Flex's Debt?
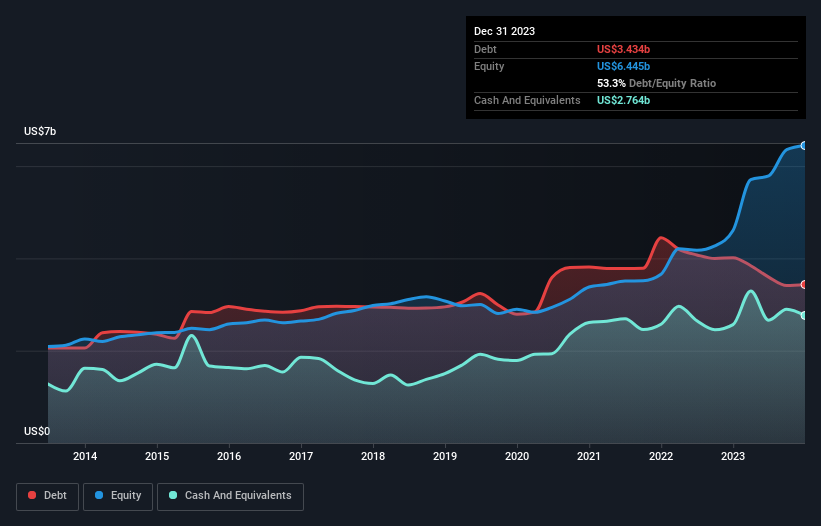
The image below, which you can click on for greater detail, shows that Flex had debt of US$3.43b at the end of December 2023, a reduction from US$4.02b over a year. However, it also had US$2.76b in cash, and so its net debt is US$670.0m.
How Strong Is Flex's Balance Sheet?
We can see from the most recent balance sheet that Flex had liabilities of US$9.39b falling due within a year, and liabilities of US$4.54b due beyond that. Offsetting these obligations, it had cash of US$2.76b as well as receivables valued at US$4.21b due within 12 months. So its liabilities total US$6.95b more than the combination of its cash and short-term receivables.
While this might seem like a lot, it is not so bad since Flex has a huge market capitalization of US$12.0b, and so it could probably strengthen its balance sheet by raising capital if it needed to. But it's clear that we should definitely closely examine whether it can manage its debt without dilution.
We use two main ratios to inform us about debt levels relative to earnings. The first is net debt divided by earnings before interest, tax, depreciation, and amortization (EBITDA), while the second is how many times its earnings before interest and tax (EBIT) covers its interest expense (or its interest cover, for short). This way, we consider both the absolute quantum of the debt, as well as the interest rates paid on it.
Flex has net debt of just 0.35 times EBITDA, indicating that it is certainly not a reckless borrower. And this view is supported by the solid interest coverage, with EBIT coming in at 8.8 times the interest expense over the last year. Also positive, Flex grew its EBIT by 21% in the last year, and that should make it easier to pay down debt, going forward. There's no doubt that we learn most about debt from the balance sheet. But ultimately the future profitability of the business will decide if Flex can strengthen its balance sheet over time. So if you're focused on the future you can check out this free report showing analyst profit forecasts.
Finally, a company can only pay off debt with cold hard cash, not accounting profits. So the logical step is to look at the proportion of that EBIT that is matched by actual free cash flow. Looking at the most recent three years, Flex recorded free cash flow of 32% of its EBIT, which is weaker than we'd expect. That's not great, when it comes to paying down debt.
Our View
Both Flex's ability to handle its debt, based on its EBITDA, and its EBIT growth rate gave us comfort that it can handle its debt. Having said that, its level of total liabilities somewhat sensitizes us to potential future risks to the balance sheet. When we consider all the elements mentioned above, it seems to us that Flex is managing its debt quite well. But a word of caution: we think debt levels are high enough to justify ongoing monitoring. The balance sheet is clearly the area to focus on when you are analysing debt. However, not all investment risk resides within the balance sheet - far from it. For example, we've discovered 1 warning sign for Flex that you should be aware of before investing here.
If, after all that, you're more interested in a fast growing company with a rock-solid balance sheet, then check out our list of net cash growth stocks without delay.
New: AI Stock Screener & Alerts
Our new AI Stock Screener scans the market every day to uncover opportunities.
• Dividend Powerhouses (3%+ Yield)
• Undervalued Small Caps with Insider Buying
• High growth Tech and AI Companies
Or build your own from over 50 metrics.
Have feedback on this article? Concerned about the content? Get in touch with us directly. Alternatively, email editorial-team (at) simplywallst.com.
This article by Simply Wall St is general in nature. We provide commentary based on historical data and analyst forecasts only using an unbiased methodology and our articles are not intended to be financial advice. It does not constitute a recommendation to buy or sell any stock, and does not take account of your objectives, or your financial situation. We aim to bring you long-term focused analysis driven by fundamental data. Note that our analysis may not factor in the latest price-sensitive company announcements or qualitative material. Simply Wall St has no position in any stocks mentioned.
About NasdaqGS:FLEX
Flex
Provides technology innovation, supply chain, and manufacturing solutions to data center, communications, enterprise, consumer, automotive, industrial, healthcare, industrial, and power industries.
Exceptional growth potential with flawless balance sheet.
Similar Companies
Market Insights


Advertisement
Weekly Picks
ST


stuart_roberts on Unicycive Therapeutics ·
Looking to be second time lucky with a game-changing new product
Fair Value:US$21.5360.2% undervalued
137 followersusers have followed this narrative
0 commentsusers have commented on this narrative
19 likesusers have liked this narrative
DE


Degen_GCR on Everpure ·
Second order memory play likely to double in a year
Fair Value:US$18053.4% undervalued
21 followersusers have followed this narrative
1 commentusers have commented on this narrative
15 likesusers have liked this narrative
DO


Double_Bubbler on Intuitive Machines ·
Intuitive Machines: To The Moon and Beyond!
Fair Value:US$42.313.7% undervalued
12 followersusers have followed this narrative
0 commentsusers have commented on this narrative
5 likesusers have liked this narrative
YI

yiannisz on AppLovin ·
AppLovin’s AI Engine Is Printing Profit
Fair Value:US$989.2451.0% undervalued
32 followersusers have followed this narrative
2 commentsusers have commented on this narrative
1 likeusers have liked this narrative
Recently Updated Narratives
MR


MRT23 on CorMedix ·
CRMD is trading at 5.9x trough-year EBITDA with the market ascribing near-zero value to two near-term pipeline events
Fair Value:US$1233.9% undervalued
6 followersusers have followed this narrative
0 commentsusers have commented on this narrative
0 likesusers have liked this narrative
KA

kapirey on Everpure ·
Everpure's AI Infrastructure Transition Will Boost Future Valuation
Fair Value:US$74.7812.1% overvalued
1 followerusers have followed this narrative
0 commentsusers have commented on this narrative
0 likesusers have liked this narrative
KA

kapirey on IREN ·
IREN to Transform into AI Cloud Giant with Mirantis Acquisition
Fair Value:US$44.331.8% overvalued
4 followersusers have followed this narrative
0 commentsusers have commented on this narrative
0 likesusers have liked this narrative
Popular Narratives
GO

GoldenSands on QuantumScape ·
QuantumScape: A Mispriced Deep‑Tech Inflection Point With Multi‑Billion‑Dollar Optionality
Fair Value:US$8589.9% undervalued
108 followersusers have followed this narrative
2 commentsusers have commented on this narrative
31 likesusers have liked this narrative
TR


tripledub on Meta Platforms ·
The $135 Billion Bet That Should Make Every Shareholder Nervous
Fair Value:US$74016.4% undervalued
37 followersusers have followed this narrative
3 commentsusers have commented on this narrative
33 likesusers have liked this narrative
AN


AnalystConsensusTarget on NVIDIA ·
NVDA: Expanding AI Demand Will Drive Major Data Center Investments Through 2026
Fair Value:US$268.6112.2% undervalued
1182 followersusers have followed this narrative
7 commentsusers have commented on this narrative
34 likesusers have liked this narrative

