Advertisement
- United States
- /
- Electronic Equipment and Components
- /
- NasdaqGS:FLEX
Assessing Flex (FLEX) Valuation After Earnings Beat And Data Center Cooling Update
Flex (FLEX) is back in focus after quarterly results topped analyst forecasts and its JetCool unit rolled out new liquid cooling solutions at an Equinix data center, highlighting the company’s data center infrastructure capabilities.
See our latest analysis for Flex.
Flex’s recent data center wins and earnings beat come after a mixed stretch for the share price, with a 1-month share price return of a 9.68% decline, a 1-year total shareholder return of 54.65%, and a 5-year total shareholder return of 368.35%. This suggests longer term momentum has been strong even as near term sentiment has cooled.
If Flex’s data center story has your attention, it could be a good moment to see how it compares with other high growth tech and AI stocks that are riding similar themes in infrastructure and AI.
With Flex trading at US$62.14, sitting at a modest discount to both its analyst price target and an intrinsic value estimate, investors may question whether there is still upside potential or whether future growth is already fully reflected in the share price.
Most Popular Narrative: 15.5% Undervalued
With Flex shares at US$62.14 versus a narrative fair value of US$73.51, the story leans toward upside based on future earnings and cash flow assumptions.
The company's deployment of AI-enabled systems and advanced automation across its facilities is delivering meaningful productivity gains, which should support ongoing operating margin expansion and improve long-term earnings potential.
Want to see what is really backing that higher value estimate? The narrative leans on compounding earnings, firmer margins, and a future earnings multiple that might surprise you.
Result: Fair Value of $73.51 (UNDERVALUED)
Have a read of the narrative in full and understand what's behind the forecasts.
However, this higher value story could be knocked off course if key hyperscale clients shift work in house, or if thin margins meet cost pressure or weaker end markets.
Find out about the key risks to this Flex narrative.
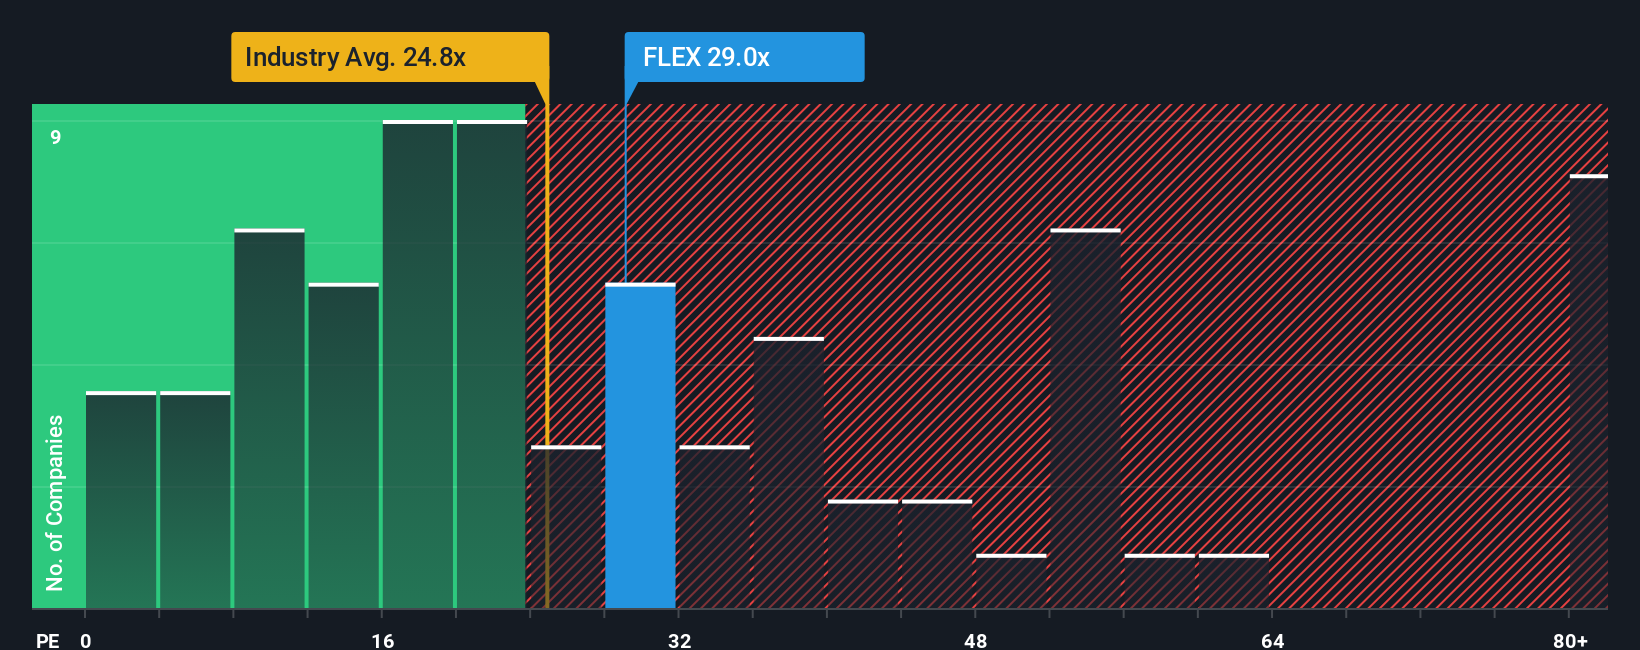
Another View: What P/E Is Telling You
If you put the narratives to one side and just look at the current P/E, the picture is less clear cut. Flex trades at 26.2x earnings, slightly higher than the US Electronic industry at 26x, but below peer averages at 38.8x and our fair ratio of 32.7x.
So the market is pricing Flex a touch richer than the sector, yet cheaper than peers and the fair ratio. This suggests there may be some potential upside, but also less margin for error if growth or margins disappoint. How comfortable are you with that trade off?
See what the numbers say about this price — find out in our valuation breakdown.
Build Your Own Flex Narrative
If you see the numbers differently, or simply want to test your own assumptions against the data, you can build a custom view in minutes: Do it your way
A great starting point for your Flex research is our analysis highlighting 3 key rewards and 1 important warning sign that could impact your investment decision.
Ready For Your Next Investing Move?
If Flex has sharpened your thinking, do not stop here. Use the Simply Wall Street Screener to spot other ideas that fit what you care about most.
- Target potential value opportunities by reviewing these 883 undervalued stocks based on cash flows that pair company fundamentals with discounted prices based on cash flows.
- Spot future facing themes by scanning these 25 AI penny stocks that are tied to artificial intelligence across different parts of the market.
- Strengthen your income watchlist by checking out these 12 dividend stocks with yields > 3% that already offer yields above 3%.
This article by Simply Wall St is general in nature. We provide commentary based on historical data and analyst forecasts only using an unbiased methodology and our articles are not intended to be financial advice. It does not constitute a recommendation to buy or sell any stock, and does not take account of your objectives, or your financial situation. We aim to bring you long-term focused analysis driven by fundamental data. Note that our analysis may not factor in the latest price-sensitive company announcements or qualitative material. Simply Wall St has no position in any stocks mentioned.
New: AI Stock Screener & Alerts
Our new AI Stock Screener scans the market every day to uncover opportunities.
• Dividend Powerhouses (3%+ Yield)
• Undervalued Small Caps with Insider Buying
• High growth Tech and AI Companies
Or build your own from over 50 metrics.
Have feedback on this article? Concerned about the content? Get in touch with us directly. Alternatively, email editorial-team@simplywallst.com
About NasdaqGS:FLEX
Flex
Provides technology innovation, supply chain, and manufacturing solutions to data center, communications, enterprise, consumer, automotive, industrial, healthcare, industrial, and power industries.
Flawless balance sheet with reasonable growth potential.
Similar Companies
Market Insights


Advertisement
Weekly Picks
ST


stuart_roberts on Upside Gold ·
An Undervalued 3.3Moz Gold Project in Canada
Fair Value:CA$5.0776.3% undervalued
143 followersusers have followed this narrative
1 commentusers have commented on this narrative
24 likesusers have liked this narrative
CL


Clive_Thompson on Hermès International Société en commandite par actions ·
Hermès - Expensive bags, and expensive stock. And the story of €14 billion of bearer shares gone missing.
Fair Value:€1.51k22.4% overvalued
3 followersusers have followed this narrative
0 commentsusers have commented on this narrative
5 likesusers have liked this narrative
SU

superbullll on Cheniere Energy ·
Cheniere Energy (LNG) — The Toll Road That Geopolitics Just Made More Valuable
Fair Value:US$320.9421.6% undervalued
2 followersusers have followed this narrative
0 commentsusers have commented on this narrative
1 likeusers have liked this narrative
SA

Salman2415 on GNG Electronics ·
Strong execution in a growing category, but long‑term value hinges on cash‑flow discipline
Fair Value:₹135.87177.0% overvalued
3 followersusers have followed this narrative
1 commentusers have commented on this narrative
1 likeusers have liked this narrative
Recently Updated Narratives
VE

Vestra on Red Cat Holdings ·
Red Cat Holdings (RCAT): The Small-Drone Contender Bracing for Q4 Impact
Fair Value:US$18.458.0% undervalued
1 followerusers have followed this narrative
0 commentsusers have commented on this narrative
0 likesusers have liked this narrative
VE

Vestra on Micron Technology ·
Micron Technology Inc. (MU): The "Silicon Gold" Rush Reaches a Fever Pitch
Fair Value:US$4956.7% undervalued
9 followersusers have followed this narrative
0 commentsusers have commented on this narrative
0 likesusers have liked this narrative
VE

Vestra on Jabil ·
Jabil Inc. (JBL): The AI "Picks and Shovels" Play Ahead of Earnings
Fair Value:US$295.511.2% undervalued
1 followerusers have followed this narrative
0 commentsusers have commented on this narrative
0 likesusers have liked this narrative
Popular Narratives
KA

kabz2342 on Nu Holdings ·
Nu holdings will continue to disrupt the South American banking market
Fair Value:US$64.377.8% undervalued
54 followersusers have followed this narrative
3 commentsusers have commented on this narrative
29 likesusers have liked this narrative
YA

Yang_ on SoFi Technologies ·
SoFi Technologies: The Apex Aggregator and the Infrastructure of the Modern Financial System
Fair Value:US$22.9824.4% undervalued
45 followersusers have followed this narrative
0 commentsusers have commented on this narrative
33 likesusers have liked this narrative
AN


AnalystConsensusTarget on Microsoft ·
Analyst Commentary Highlights Microsoft AI Momentum and Upward Valuation Amid Growth and Competitive Risks
Fair Value:US$59633.0% undervalued
1312 followersusers have followed this narrative
2 commentsusers have commented on this narrative
10 likesusers have liked this narrative
Trending Discussion


DA

daqui_luis on Corticeira Amorim S.G.P.S ·
Great analysis on a great and solid company with a dominant position in the Cork Market.
1
|0