
Advertisement

Howard Marks put it nicely when he said that, rather than worrying about share price volatility, 'The possibility of permanent loss is the risk I worry about... and every practical investor I know worries about.' When we think about how risky a company is, we always like to look at its use of debt, since debt overload can lead to ruin. As with many other companies F5, Inc. (NASDAQ:FFIV) makes use of debt. But should shareholders be worried about its use of debt?
Why Does Debt Bring Risk?
Generally speaking, debt only becomes a real problem when a company can't easily pay it off, either by raising capital or with its own cash flow. If things get really bad, the lenders can take control of the business. However, a more usual (but still expensive) situation is where a company must dilute shareholders at a cheap share price simply to get debt under control. Of course, the upside of debt is that it often represents cheap capital, especially when it replaces dilution in a company with the ability to reinvest at high rates of return. When we think about a company's use of debt, we first look at cash and debt together.
Check out our latest analysis for F5
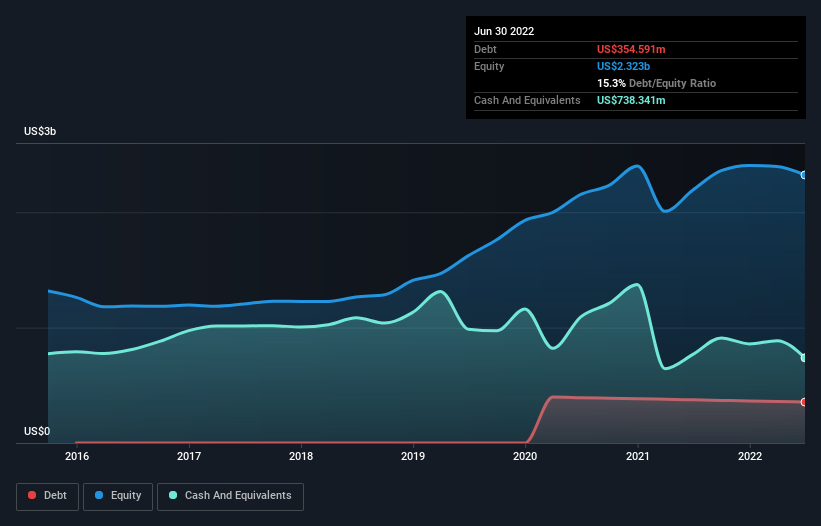
How Much Debt Does F5 Carry?
You can click the graphic below for the historical numbers, but it shows that F5 had US$354.6m of debt in June 2022, down from US$373.9m, one year before. But on the other hand it also has US$738.3m in cash, leading to a US$383.8m net cash position.
A Look At F5's Liabilities
Zooming in on the latest balance sheet data, we can see that F5 had liabilities of US$1.77b due within 12 months and liabilities of US$929.6m due beyond that. Offsetting this, it had US$738.3m in cash and US$733.5m in receivables that were due within 12 months. So it has liabilities totalling US$1.23b more than its cash and near-term receivables, combined.
Of course, F5 has a market capitalization of US$8.85b, so these liabilities are probably manageable. Having said that, it's clear that we should continue to monitor its balance sheet, lest it change for the worse. Despite its noteworthy liabilities, F5 boasts net cash, so it's fair to say it does not have a heavy debt load!
The good news is that F5 has increased its EBIT by 2.5% over twelve months, which should ease any concerns about debt repayment. When analysing debt levels, the balance sheet is the obvious place to start. But ultimately the future profitability of the business will decide if F5 can strengthen its balance sheet over time. So if you're focused on the future you can check out this free report showing analyst profit forecasts.
But our final consideration is also important, because a company cannot pay debt with paper profits; it needs cold hard cash. While F5 has net cash on its balance sheet, it's still worth taking a look at its ability to convert earnings before interest and tax (EBIT) to free cash flow, to help us understand how quickly it is building (or eroding) that cash balance. Over the last three years, F5 actually produced more free cash flow than EBIT. There's nothing better than incoming cash when it comes to staying in your lenders' good graces.
Summing Up
While F5 does have more liabilities than liquid assets, it also has net cash of US$383.8m. The cherry on top was that in converted 128% of that EBIT to free cash flow, bringing in US$453m. So is F5's debt a risk? It doesn't seem so to us. Over time, share prices tend to follow earnings per share, so if you're interested in F5, you may well want to click here to check an interactive graph of its earnings per share history.
At the end of the day, it's often better to focus on companies that are free from net debt. You can access our special list of such companies (all with a track record of profit growth). It's free.
New: AI Stock Screener & Alerts
Our new AI Stock Screener scans the market every day to uncover opportunities.
• Dividend Powerhouses (3%+ Yield)
• Undervalued Small Caps with Insider Buying
• High growth Tech and AI Companies
Or build your own from over 50 metrics.
Have feedback on this article? Concerned about the content? Get in touch with us directly. Alternatively, email editorial-team (at) simplywallst.com.
This article by Simply Wall St is general in nature. We provide commentary based on historical data and analyst forecasts only using an unbiased methodology and our articles are not intended to be financial advice. It does not constitute a recommendation to buy or sell any stock, and does not take account of your objectives, or your financial situation. We aim to bring you long-term focused analysis driven by fundamental data. Note that our analysis may not factor in the latest price-sensitive company announcements or qualitative material. Simply Wall St has no position in any stocks mentioned.
About NasdaqGS:FFIV
F5
Provides multicloud application security and delivery solutions in the United States, Europe, the Middle East, Africa, and the Asia Pacific region.
Flawless balance sheet with solid track record.
Similar Companies
Market Insights

Advertisement
Community Narratives
Groundbreaking therapies that could change the treatment landscape for PTSD, fibromyalgia, MS & Alzheimer’s
Fair Value US$6.20|86.9% undervalued
CM
Community Contributor
DigitalOcean Will Grow 14% by Embracing AI with Paperspace Acquisition
Fair Value US$50.00|40.2% undervalued
NE
Community Contributor
Viant Technology: A Rising AdTech Challenger in the AI-Powered CTV Market
Fair Value US$38.61|62.7% undervalued
BL
Community Contributor
Volvo will Accelerate Forward into Electric and Autonomous Leadership in Five Years
Fair Value SEK 438.80|40.1% undervalued
UN
Community Contributor