Advertisement
- United States
- /
- Communications
- /
- NasdaqGS:CSCO
Cisco's (NASDAQ:CSCO) Buyback Plan Falls in Line With our Intrinsic Value Outlook
After a strong performance in 2021, Cisco Systems, Inc. (NASDAQ: CSCO) pulled back 15% from the highs, leading the broad market decline by 4%.
With a reasonable valuation and a stable dividend, Cisco is an interesting prospect in the current environment.
View our latest analysis for Cisco Systems
Q4 Earnings Results
- GAAP EPS: US$0.84 (beat by US$0.16)
- Revenue: US$12.7b (beat by US$30m)
- Revenue growth: +5.8% Y/Y
Other highlights
- FY 2022 guidance growth: +5.5-6.5% Y/Y vs. 5.9% consensus
- Additional buyback authorized – US$15b, up to US$18b
- Dividend increase – 3%, FY yield 2.80%
Reflecting on the 2021 results, CEO Chuck Robbins pointed out 37% order growth in enterprise business, the largest one in years. Obviously, the company is taking advantage of the growing enterprise need to improve and modernize its networks. He maintains the goal to achieve net-zero emissions by 2040 by focusing on power efficiency.
What is Cisco's Intrinsic Value?
We generally believe that a company's value is the present value of all cash it will generate in the future. However, a DCF is just one valuation metric among many, and it is not without flaws. Anyone interested in learning a bit more about intrinsic value should have a read of the Simply Wall St analysis model.
Step by step through the calculation
We use what is known as a 2-stage model, which means we have two different periods of growth rates for the company's cash flows. Generally, the first stage is higher growth, and the second stage is lower. First, we need to estimate the next ten years of cash flows. Where possible, we use analyst estimates, but when these aren't available, we extrapolate the previous free cash flow (FCF) from the last estimate or reported value.
We assume companies with shrinking free cash flow will slow their rate of shrinkage and that companies with growing free cash flow will see their growth rate slow over this period. We do this to reflect that growth tends to slow more in the early years than in later years.
A DCF is all about the idea that a dollar in the future is less valuable than a dollar today, so we discount the value of these future cash flows to their estimated worth in today's dollars:
10-year free cash flow (FCF) estimate
| 2022 | 2023 | 2024 | 2025 | 2026 | 2027 | 2028 | 2029 | 2030 | 2031 | |
| Levered FCF ($, Millions) | US$15.7b | US$16.6b | US$17.5b | US$17.9b | US$17.3b | US$17.0b | US$16.9b | US$16.9b | US$17.0b | US$17.2b |
| Growth Rate Estimate Source | Analyst x8 | Analyst x9 | Analyst x7 | Analyst x3 | Analyst x2 | Est @ -1.71% | Est @ -0.62% | Est @ 0.14% | Est @ 0.68% | Est @ 1.05% |
| Present Value ($, Millions) Discounted @ 6.2% | US$14.8k | US$14.8k | US$14.6k | US$14.1k | US$12.8k | US$11.8k | US$11.1k | US$10.4k | US$9.9k | US$9.4k |
("Est" = FCF growth rate estimated by Simply Wall St)
Present Value of 10-year Cash Flow (PVCF) = US$124b
The second stage is also known as Terminal Value, and this is the business's cash flow after the first stage. For some reasons, a very conservative growth rate is used that cannot exceed that of a country's GDP growth. In this case, we have used the 5-year average of the 10-year government bond yield (1.9%) to estimate future growth. In the same way, as with the 10-year 'growth' period, we discount future cash flows to today's value, using a cost of equity of 6.2%.
Terminal Value (TV)= FCF2031 × (1 + g) ÷ (r – g) = US$17b× (1 + 1.9%) ÷ (6.2%– 1.9%) = US$410b
Present Value of Terminal Value (PVTV)= TV / (1 + r)10= US$410b÷ ( 1 + 6.2%)10= US$225b
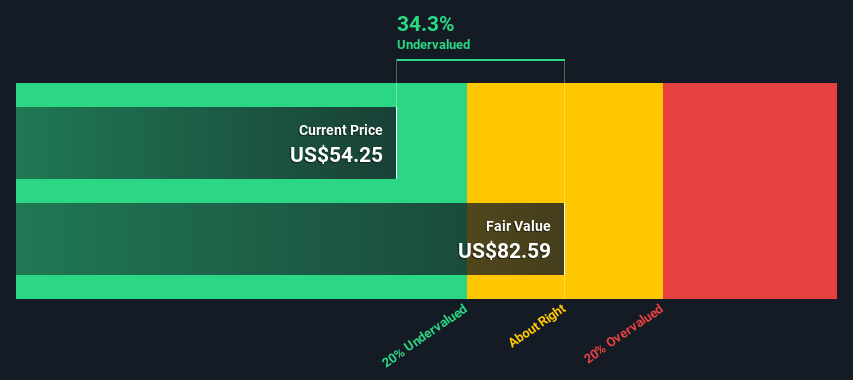
The total value, or equity value, is then the sum of the present value of the future cash flows, which in this case is US$348b. The last step is to divide the equity value by the number of shares outstanding. Compared to the current share price of US$54.3, the company appears relatively undervalued at a 34% discount to where the stock price trades currently.
The assumptions in any calculation have a significant impact on the valuation, so it is better to view this as a rough estimate.
Important assumptions
We would point out that the most critical inputs to a discounted cash flow are the discount rate and, of course, the actual cash flows. The DCF does not consider the possible cyclicality of an industry or its future capital requirements, so it does not give a complete picture of its potential performance. Given that we are looking at Cisco Systems as potential shareholders, the cost of equity is used as the discount rate rather than the cost of capital (or the weighted average cost of capital, WACC), which accounts for debt.
We've used 6.2% in this calculation, which is based on a levered beta of 1.007. Beta is a measure of a stock's volatility compared to the market as a whole.
Moving On:
Cisco Systems declined more than the broad market and now trades at approximately 15x the forward earnings. While not a bargain by the traditional metrics, this is a reasonable valuation for such an established player in the sector.
While a 1 cent dividend increase might sound pitiful, a boost to a buyback program signals that the company's management believes the stock might be undervalued - thus it prefers to return the value to shareholders in that way.
The DCF model is but one of the tools you might consider, for Cisco, we've put together three additional aspects you should further examine:
- Financial Health: Does CSCO have a healthy balance sheet? Please look at our free balance sheet analysis with six simple checks on key factors like leverage and risk.
- Future Earnings: How does CSCO's growth rate compare to its peers and the broader market? Dig deeper into the analyst consensus number for the upcoming years by interacting with our free analyst growth expectation chart.
- Other High-Quality Alternatives: Do you like a good all-rounder? Explore our interactive list of high-quality stocks to get an idea of what else is out there you may be missing!
PS. Simply Wall St updates its DCF calculation for every American stock every day, so if you want to find the intrinsic value of any other stock, just search here.
New: AI Stock Screener & Alerts
Our new AI Stock Screener scans the market every day to uncover opportunities.
• Dividend Powerhouses (3%+ Yield)
• Undervalued Small Caps with Insider Buying
• High growth Tech and AI Companies
Or build your own from over 50 metrics.
Have feedback on this article? Concerned about the content? Get in touch with us directly. Alternatively, email editorial-team@simplywallst.com
Simply Wall St analyst Stjepan Kalinic and Simply Wall St have no position in any of the companies mentioned. This article is general in nature. We provide commentary based on historical data and analyst forecasts only using an unbiased methodology and our articles are not intended to be financial advice. It does not constitute a recommendation to buy or sell any stock and does not take account of your objectives, or your financial situation. We aim to bring you long-term focused analysis driven by fundamental data. Note that our analysis may not factor in the latest price-sensitive company announcements or qualitative material.

Stjepan Kalinic
Stjepan is a writer and an analyst covering equity markets. As a former multi-asset analyst, he prefers to look beyond the surface and uncover ideas that might not be on retail investors' radar. You can find his research all over the internet, including Simply Wall St News, Yahoo Finance, Benzinga, Vincent, and Barron's.
About NasdaqGS:CSCO
Cisco Systems
Designs, developes, and sells technologies that help to power, secure, and draw insights from the internet in the Americas, Europe, the Middle East, Africa, the Asia Pacific, Japan, and China.
Established dividend payer and good value.
Similar Companies
Market Insights

Advertisement
Community Narratives
The company that turned a verb into a global necessity and basically runs the modern internet, digital ads, smartphones, maps, and AI.
Fair Value US$300.00|7.1% undervalued
OS
Community Contributor
Flowers Foods Pays A Fair Price For Health
Fair Value US$16.12|26.4% undervalued
NV
Community Contributor
TMX Group will thrive with 33.3% profit margin and enduring market moat
Fair Value CA$49.90|0.8% overvalued
LI
Community Contributor
The "Molecular Pencil": Why Beam's Technology is Built to Win
Fair Value US$65.01|65.8% undervalued
DA
Community Contributor