Stock Analysis
- United States
- /
- Software
- /
- NasdaqGS:VRNT
Investors more bullish on Verint Systems (NASDAQ:VRNT) this week as stock advances 6.5%, despite earnings trending downwards over past five years


Verint Systems Inc. (NASDAQ:VRNT) shareholders should be happy to see the share price up 15% in the last quarter. But that doesn't change the fact that the returns over the last five years have been less than pleasing. You would have done a lot better buying an index fund, since the stock has dropped 38% in that half decade.
On a more encouraging note the company has added US$133m to its market cap in just the last 7 days, so let's see if we can determine what's driven the five-year loss for shareholders.
Check out our latest analysis for Verint Systems
While the efficient markets hypothesis continues to be taught by some, it has been proven that markets are over-reactive dynamic systems, and investors are not always rational. One imperfect but simple way to consider how the market perception of a company has shifted is to compare the change in the earnings per share (EPS) with the share price movement.
During five years of share price growth, Verint Systems moved from a loss to profitability. That would generally be considered a positive, so we are surprised to see the share price is down. Other metrics may better explain the share price move.
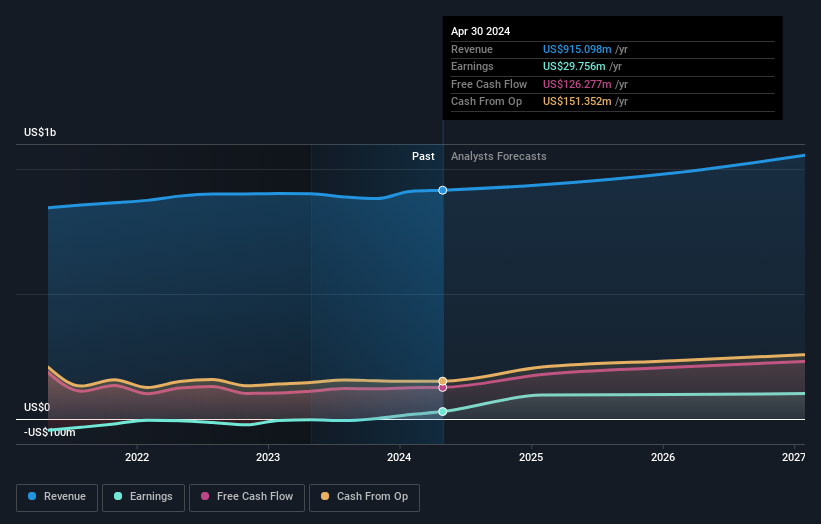
It could be that the revenue decline of 6.5% per year is viewed as evidence that Verint Systems is shrinking. This has probably encouraged some shareholders to sell down the stock.
You can see how earnings and revenue have changed over time in the image below (click on the chart to see the exact values).
We know that Verint Systems has improved its bottom line over the last three years, but what does the future have in store? If you are thinking of buying or selling Verint Systems stock, you should check out this FREE detailed report on its balance sheet.
What About The Total Shareholder Return (TSR)?
We've already covered Verint Systems' share price action, but we should also mention its total shareholder return (TSR). The TSR is a return calculation that accounts for the value of cash dividends (assuming that any dividend received was reinvested) and the calculated value of any discounted capital raisings and spin-offs. Verint Systems hasn't been paying dividends, but its TSR of 23% exceeds its share price return of -38%, implying it has either spun-off a business, or raised capital at a discount; thereby providing additional value to shareholders.
A Different Perspective
Investors in Verint Systems had a tough year, with a total loss of 3.7%, against a market gain of about 20%. Even the share prices of good stocks drop sometimes, but we want to see improvements in the fundamental metrics of a business, before getting too interested. On the bright side, long term shareholders have made money, with a gain of 4% per year over half a decade. If the fundamental data continues to indicate long term sustainable growth, the current sell-off could be an opportunity worth considering. I find it very interesting to look at share price over the long term as a proxy for business performance. But to truly gain insight, we need to consider other information, too. Even so, be aware that Verint Systems is showing 1 warning sign in our investment analysis , you should know about...
If you like to buy stocks alongside management, then you might just love this free list of companies. (Hint: many of them are unnoticed AND have attractive valuation).
Please note, the market returns quoted in this article reflect the market weighted average returns of stocks that currently trade on American exchanges.
New: Manage All Your Stock Portfolios in One Place
We've created the ultimate portfolio companion for stock investors, and it's free.
• Connect an unlimited number of Portfolios and see your total in one currency
• Be alerted to new Warning Signs or Risks via email or mobile
• Track the Fair Value of your stocks
Have feedback on this article? Concerned about the content? Get in touch with us directly. Alternatively, email editorial-team (at) simplywallst.com.
This article by Simply Wall St is general in nature. We provide commentary based on historical data and analyst forecasts only using an unbiased methodology and our articles are not intended to be financial advice. It does not constitute a recommendation to buy or sell any stock, and does not take account of your objectives, or your financial situation. We aim to bring you long-term focused analysis driven by fundamental data. Note that our analysis may not factor in the latest price-sensitive company announcements or qualitative material. Simply Wall St has no position in any stocks mentioned.
Have feedback on this article? Concerned about the content? Get in touch with us directly. Alternatively, email editorial-team@simplywallst.com
About NasdaqGS:VRNT
Excellent balance sheet with reasonable growth potential.
