
Advertisement
- United States
- /
- Software
- /
- NasdaqCM:SMSI
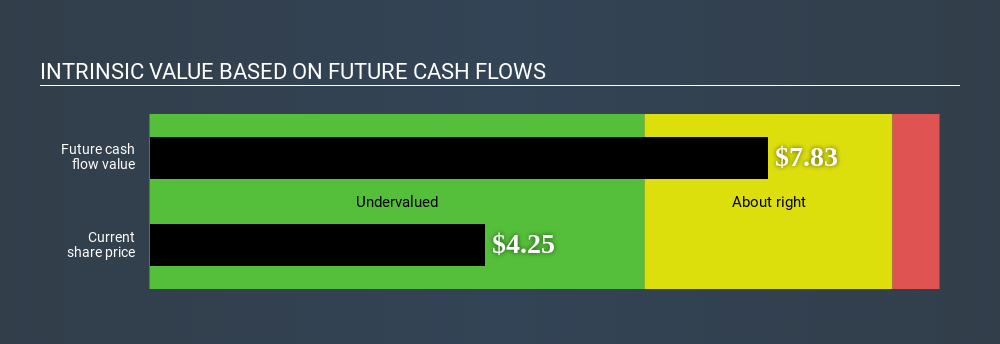
An Intrinsic Calculation For Smith Micro Software, Inc. (NASDAQ:SMSI) Suggests It's 46% Undervalued

Today we will run through one way of estimating the intrinsic value of Smith Micro Software, Inc. (NASDAQ:SMSI) by taking the foreast future cash flows of the company and discounting them back to today's value. This is done using the Discounted Cash Flow (DCF) model. It may sound complicated, but actually it is quite simple!
Remember though, that there are many ways to estimate a company's value, and a DCF is just one method. If you want to learn more about discounted cash flow, the rationale behind this calculation can be read in detail in the Simply Wall St analysis model.
View our latest analysis for Smith Micro Software
Step by step through the calculation
We're using the 2-stage growth model, which simply means we take in account two stages of company's growth. In the initial period the company may have a higher growth rate and the second stage is usually assumed to have a stable growth rate. In the first stage we need to estimate the cash flows to the business over the next ten years. Where possible we use analyst estimates, but when these aren't available we extrapolate the previous free cash flow (FCF) from the last estimate or reported value. We assume companies with shrinking free cash flow will slow their rate of shrinkage, and that companies with growing free cash flow will see their growth rate slow, over this period. We do this to reflect that growth tends to slow more in the early years than it does in later years.
A DCF is all about the idea that a dollar in the future is less valuable than a dollar today, and so the sum of these future cash flows is then discounted to today's value:
10-year free cash flow (FCF) forecast
| 2020 | 2021 | 2022 | 2023 | 2024 | 2025 | 2026 | 2027 | 2028 | 2029 | |
| Levered FCF ($, Millions) | US$1.55m | US$9.30m | US$12.5m | US$15.7m | US$18.5m | US$21.0m | US$23.1m | US$24.9m | US$26.4m | US$27.7m |
| Growth Rate Estimate Source | Analyst x1 | Analyst x1 | Est @ 34.82% | Est @ 25.04% | Est @ 18.2% | Est @ 13.4% | Est @ 10.05% | Est @ 7.7% | Est @ 6.06% | Est @ 4.9% |
| Present Value ($, Millions) Discounted @ 8.2% | US$1.4 | US$7.9 | US$9.9 | US$11.4 | US$12.5 | US$13.1 | US$13.3 | US$13.3 | US$13.0 | US$12.6 |
("Est" = FCF growth rate estimated by Simply Wall St)
Present Value of 10-year Cash Flow (PVCF) = US$108m
We now need to calculate the Terminal Value, which accounts for all the future cash flows after this ten year period. For a number of reasons a very conservative growth rate is used that cannot exceed that of a country's GDP growth. In this case we have used the 10-year government bond rate (2.2%) to estimate future growth. In the same way as with the 10-year 'growth' period, we discount future cash flows to today's value, using a cost of equity of 8.2%.
Terminal Value (TV)= FCF2029 × (1 + g) ÷ (r – g) = US$28m× (1 + 2.2%) ÷ 8.2%– 2.2%) = US$475m
Present Value of Terminal Value (PVTV)= TV / (1 + r)10= US$475m÷ ( 1 + 8.2%)10= US$216m
The total value, or equity value, is then the sum of the present value of the future cash flows, which in this case is US$324m. The last step is to then divide the equity value by the number of shares outstanding. Relative to the current share price of US$4.3, the company appears quite undervalued at a 46% discount to where the stock price trades currently. Valuations are imprecise instruments though, rather like a telescope - move a few degrees and end up in a different galaxy. Do keep this in mind.
Important assumptions
Now the most important inputs to a discounted cash flow are the discount rate, and of course, the actual cash flows. You don't have to agree with these inputs, I recommend redoing the calculations yourself and playing with them. The DCF also does not consider the possible cyclicality of an industry, or a company's future capital requirements, so it does not give a full picture of a company's potential performance. Given that we are looking at Smith Micro Software as potential shareholders, the cost of equity is used as the discount rate, rather than the cost of capital (or weighted average cost of capital, WACC) which accounts for debt. In this calculation we've used 8.2%, which is based on a levered beta of 0.992. Beta is a measure of a stock's volatility, compared to the market as a whole. We get our beta from the industry average beta of globally comparable companies, with an imposed limit between 0.8 and 2.0, which is a reasonable range for a stable business.
Next Steps:
Valuation is only one side of the coin in terms of building your investment thesis, and it shouldn’t be the only metric you look at when researching a company. The DCF model is not a perfect stock valuation tool. Rather it should be seen as a guide to "what assumptions need to be true for this stock to be under/overvalued?" If a company grows at a different rate, or if its cost of equity or risk free rate changes sharply, the output can look very different. What is the reason for the share price to differ from the intrinsic value? For Smith Micro Software, We've compiled three fundamental aspects you should further research:
- Risks: Be aware that Smith Micro Software is showing 2 warning signs in our investment analysis , you should know about...
- Future Earnings: How does SMSI's growth rate compare to its peers and the wider market? Dig deeper into the analyst consensus number for the upcoming years by interacting with our free analyst growth expectation chart.
- Other High Quality Alternatives: Do you like a good all-rounder? Explore our interactive list of high quality stocks to get an idea of what else is out there you may be missing!
PS. The Simply Wall St app conducts a discounted cash flow valuation for every stock on the NASDAQCM every day. If you want to find the calculation for other stocks just search here.
Love or hate this article? Concerned about the content? Get in touch with us directly. Alternatively, email editorial-team@simplywallst.com.
This article by Simply Wall St is general in nature. It does not constitute a recommendation to buy or sell any stock, and does not take account of your objectives, or your financial situation. We aim to bring you long-term focused analysis driven by fundamental data. Note that our analysis may not factor in the latest price-sensitive company announcements or qualitative material. Simply Wall St has no position in any stocks mentioned. Thank you for reading.
About NasdaqCM:SMSI
Smith Micro Software
Develops and sells software solutions to simplify and enhance the mobile experience to wireless and cable service providers in the Americas, Europe, the Middle East, and Africa.
Undervalued moderate.
Market Insights


Advertisement
Community Narratives
For the Emperor: Why Games Workshop Could Be a Star Investment
Fair Value UK£160.00|0.4% undervalued
RO
Community Contributor
Securitas will boost margins with AI and tech-driven services
Fair Value SEK 260.91|45.0% undervalued
UN
Community Contributor
A Leader in EV Charging with Growth Potential
Fair Value €27.00|20.4% undervalued
TI
Community Contributor