
Advertisement
- United States
- /
- Software
- /
- NasdaqCM:SLNH
Investors Give Soluna Holdings, Inc. (NASDAQ:SLNH) Shares A 37% Hiding

The Soluna Holdings, Inc. (NASDAQ:SLNH) share price has fared very poorly over the last month, falling by a substantial 37%. The recent drop completes a disastrous twelve months for shareholders, who are sitting on a 61% loss during that time.
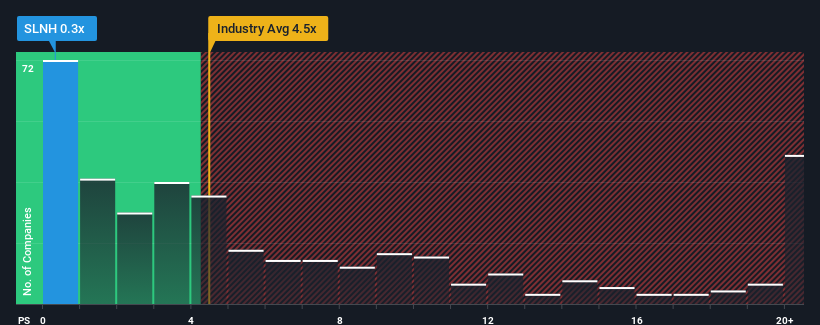
After such a large drop in price, Soluna Holdings may be sending very bullish signals at the moment with its price-to-sales (or "P/S") ratio of 0.3x, since almost half of all companies in the Software industry in the United States have P/S ratios greater than 4.5x and even P/S higher than 11x are not unusual. Although, it's not wise to just take the P/S at face value as there may be an explanation why it's so limited.
View our latest analysis for Soluna Holdings
What Does Soluna Holdings' Recent Performance Look Like?
For example, consider that Soluna Holdings' financial performance has been poor lately as its revenue has been in decline. One possibility is that the P/S is low because investors think the company won't do enough to avoid underperforming the broader industry in the near future. Those who are bullish on Soluna Holdings will be hoping that this isn't the case so that they can pick up the stock at a lower valuation.
Want the full picture on earnings, revenue and cash flow for the company? Then our free report on Soluna Holdings will help you shine a light on its historical performance.How Is Soluna Holdings' Revenue Growth Trending?
Soluna Holdings' P/S ratio would be typical for a company that's expected to deliver very poor growth or even falling revenue, and importantly, perform much worse than the industry.
Taking a look back first, the company's revenue growth last year wasn't something to get excited about as it posted a disappointing decline of 26%. The latest three year period has seen an incredible overall rise in revenue, a stark contrast to the last 12 months. Therefore, it's fair to say the revenue growth recently has been superb for the company, but investors will want to ask why it is now in decline.
Comparing that recent medium-term revenue trajectory with the industry's one-year growth forecast of 15% shows it's noticeably more attractive.
In light of this, it's peculiar that Soluna Holdings' P/S sits below the majority of other companies. Apparently some shareholders believe the recent performance has exceeded its limits and have been accepting significantly lower selling prices.
What We Can Learn From Soluna Holdings' P/S?
Having almost fallen off a cliff, Soluna Holdings' share price has pulled its P/S way down as well. We'd say the price-to-sales ratio's power isn't primarily as a valuation instrument but rather to gauge current investor sentiment and future expectations.
Our examination of Soluna Holdings revealed its three-year revenue trends aren't boosting its P/S anywhere near as much as we would have predicted, given they look better than current industry expectations. When we see robust revenue growth that outpaces the industry, we presume that there are notable underlying risks to the company's future performance, which is exerting downward pressure on the P/S ratio. It appears many are indeed anticipating revenue instability, because the persistence of these recent medium-term conditions would normally provide a boost to the share price.
Plus, you should also learn about these 5 warning signs we've spotted with Soluna Holdings (including 4 which are a bit concerning).
If you're unsure about the strength of Soluna Holdings' business, why not explore our interactive list of stocks with solid business fundamentals for some other companies you may have missed.
New: Manage All Your Stock Portfolios in One Place
We've created the ultimate portfolio companion for stock investors, and it's free.
• Connect an unlimited number of Portfolios and see your total in one currency
• Be alerted to new Warning Signs or Risks via email or mobile
• Track the Fair Value of your stocks
Have feedback on this article? Concerned about the content? Get in touch with us directly. Alternatively, email editorial-team (at) simplywallst.com.
This article by Simply Wall St is general in nature. We provide commentary based on historical data and analyst forecasts only using an unbiased methodology and our articles are not intended to be financial advice. It does not constitute a recommendation to buy or sell any stock, and does not take account of your objectives, or your financial situation. We aim to bring you long-term focused analysis driven by fundamental data. Note that our analysis may not factor in the latest price-sensitive company announcements or qualitative material. Simply Wall St has no position in any stocks mentioned.
About NasdaqCM:SLNH
Soluna Holdings
Engages in the mining of cryptocurrency through data centres.
Slight with mediocre balance sheet.
Similar Companies
Market Insights

Advertisement
Community Narratives
Pinterest will surge as advertising innovations ignite revenue growth
Fair Value US$42.63|27.0% undervalued
BR
Community Contributor
Brambles' Revenue Set to Climb 14% with Profit Margins Following
Fair Value AU$21.90|5.9% overvalued
RO
Community Contributor
Challenging Future for STG as Organic Sales Decline by 8.8%
Fair Value DKK 116.13|26.8% undervalued
KA
Community Contributor