Advertisement
- United States
- /
- Software
- /
- NasdaqGM:RPD
Shareholders Will Likely Find Rapid7, Inc.'s (NASDAQ:RPD) CEO Compensation Acceptable
Key Insights
- Rapid7 to hold its Annual General Meeting on 13th of June
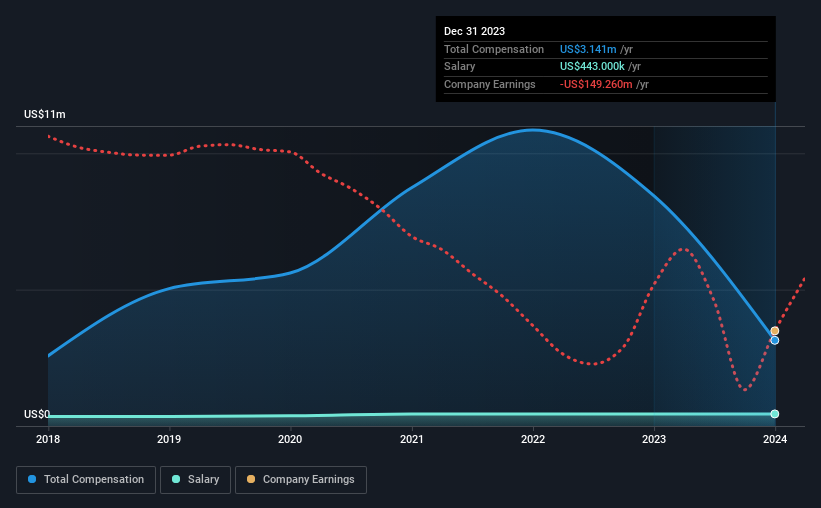
- CEO Corey Thomas' total compensation includes salary of US$443.0k
- The total compensation is 49% less than the average for the industry
- Rapid7's three-year loss to shareholders was 58% while its EPS grew by 1.1% over the past three years
The performance at Rapid7, Inc. (NASDAQ:RPD) has been rather lacklustre of late and shareholders may be wondering what CEO Corey Thomas is planning to do about this. One way they can exercise their influence on management is through voting on resolutions, such as executive remuneration at the next AGM, coming up on 13th of June. Voting on executive pay could be a powerful way to influence management, as studies have shown that the right compensation incentives impact company performance. We think CEO compensation looks appropriate given the data we have put together.
See our latest analysis for Rapid7
Comparing Rapid7, Inc.'s CEO Compensation With The Industry
Our data indicates that Rapid7, Inc. has a market capitalization of US$2.2b, and total annual CEO compensation was reported as US$3.1m for the year to December 2023. Notably, that's a decrease of 63% over the year before. We think total compensation is more important but our data shows that the CEO salary is lower, at US$443k.
For comparison, other companies in the American Software industry with market capitalizations ranging between US$1.0b and US$3.2b had a median total CEO compensation of US$6.2m. This suggests that Corey Thomas is paid below the industry median. Furthermore, Corey Thomas directly owns US$23m worth of shares in the company, implying that they are deeply invested in the company's success.
| Component | 2023 | 2022 | Proportion (2023) |
| Salary | US$443k | US$443k | 14% |
| Other | US$2.7m | US$8.0m | 86% |
| Total Compensation | US$3.1m | US$8.4m | 100% |
On an industry level, roughly 17% of total compensation represents salary and 83% is other remuneration. In Rapid7's case, non-salary compensation represents a greater slice of total remuneration, in comparison to the broader industry. If total compensation is slanted towards non-salary benefits, it indicates that CEO pay is linked to company performance.
A Look at Rapid7, Inc.'s Growth Numbers
Over the past three years, Rapid7, Inc. has seen its earnings per share (EPS) grow by 1.1% per year. It achieved revenue growth of 12% over the last year.
We would argue that the modest growth in revenue is a notable positive. And the modest growth in EPS isn't bad, either. So while we'd stop just short of calling this a top performer, but we think it is well worth watching. Moving away from current form for a second, it could be important to check this free visual depiction of what analysts expect for the future.
Has Rapid7, Inc. Been A Good Investment?
With a total shareholder return of -58% over three years, Rapid7, Inc. shareholders would by and large be disappointed. Therefore, it might be upsetting for shareholders if the CEO were paid generously.
To Conclude...
The fact that shareholders have earned a negative share price return is certainly disconcerting. The disappointing performance may have something to do with the flat earnings growth. In the upcoming AGM, shareholders should take this opportunity to raise these concerns with the board and revisit their investment thesis with regards to the company.
We can learn a lot about a company by studying its CEO compensation trends, along with looking at other aspects of the business. We did our research and identified 3 warning signs (and 1 which can't be ignored) in Rapid7 we think you should know about.
Arguably, business quality is much more important than CEO compensation levels. So check out this free list of interesting companies that have HIGH return on equity and low debt.
New: AI Stock Screener & Alerts
Our new AI Stock Screener scans the market every day to uncover opportunities.
• Dividend Powerhouses (3%+ Yield)
• Undervalued Small Caps with Insider Buying
• High growth Tech and AI Companies
Or build your own from over 50 metrics.
Have feedback on this article? Concerned about the content? Get in touch with us directly. Alternatively, email editorial-team (at) simplywallst.com.
This article by Simply Wall St is general in nature. We provide commentary based on historical data and analyst forecasts only using an unbiased methodology and our articles are not intended to be financial advice. It does not constitute a recommendation to buy or sell any stock, and does not take account of your objectives, or your financial situation. We aim to bring you long-term focused analysis driven by fundamental data. Note that our analysis may not factor in the latest price-sensitive company announcements or qualitative material. Simply Wall St has no position in any stocks mentioned.
About NasdaqGM:RPD
Rapid7
Provides cybersecurity software and services under the Rapid7, Nexpose, and Metasploit brand names.
Fair value with mediocre balance sheet.
Similar Companies
Market Insights


Advertisement
Weekly Picks
LO


Lou_Basenese on Giftify ·
Giftify ($GIFT): A Small-Cap Incentives Platform with More ScaleThan Its Valuation Suggests
Fair Value:US$2.563.5% undervalued
57 followersusers have followed this narrative
2 commentsusers have commented on this narrative
11 likesusers have liked this narrative
HA


HarishPK on lululemon athletica ·
Quantifying the Transition: Why Lululemon’s Moat Remains Intact
Fair Value:US$161.826.3% undervalued
22 followersusers have followed this narrative
2 commentsusers have commented on this narrative
9 likesusers have liked this narrative
TR


tripledub on Alphabet ·
Warren Buffett Just Bet $10 Billion on Google. The Catch? You May Already Be Too Late.
Fair Value:US$23055.3% overvalued
59 followersusers have followed this narrative
1 commentusers have commented on this narrative
16 likesusers have liked this narrative
JO


John_Eric on Veeva Systems ·
AI-Powered Veeva Systems Poised for Solid Growth Amid Regulatory Stability
Fair Value:US$32040.6% undervalued
32 followersusers have followed this narrative
0 commentsusers have commented on this narrative
6 likesusers have liked this narrative
Recently Updated Narratives
TI

TimLee on Minox International Group Berhad ·
Minox International: Undervalued Industrial Play with High-Tech Catalysts
Fair Value:RM 0.3555.7% undervalued
1 followerusers have followed this narrative
0 commentsusers have commented on this narrative
0 likesusers have liked this narrative
JO

John_Eric on Workday ·
Workday's Backlog Just Grew Faster Than Its Revenue.The Market Shrugged.
Fair Value:US$165.616.1% undervalued
1 followerusers have followed this narrative
0 commentsusers have commented on this narrative
0 likesusers have liked this narrative
RO


RockeTeller on Aftermath Silver ·
Aftermath Silver, A 35% Insider-Aligned Silver Stock With a Giant Critical Metals Twist
Fair Value:CA$30.3797.8% undervalued
6 followersusers have followed this narrative
2 commentsusers have commented on this narrative
1 likeusers have liked this narrative
Popular Narratives
IN


Investingwilly on Mastercard ·
Mastercard: The Best Dividend Stock You're Ignoring
Fair Value:US$75029.8% undervalued
87 followersusers have followed this narrative
1 commentusers have commented on this narrative
9 likesusers have liked this narrative
BL


BlackGoat on Cerebras Systems ·
The Wafer Giant Threatening NVIDIA's GPU Hegemony
Fair Value:US$415.5448.2% undervalued
60 followersusers have followed this narrative
3 commentsusers have commented on this narrative
11 likesusers have liked this narrative
TR
tripledub on Alphabet ·
Warren Buffett Just Bet $10 Billion on Google. The Catch? You May Already Be Too Late.
Fair Value:US$23055.3% overvalued
59 followersusers have followed this narrative
1 commentusers have commented on this narrative
16 likesusers have liked this narrative
Trending Discussion
DA


Dark_Oli on PPG Industries ·
Everywhere you look, PPG are there with paint. This compagny are a super one
0
|0