
Advertisement
- United States
- /
- Software
- /
- NasdaqCM:RIOT
With A 28% Price Drop For Riot Platforms, Inc. (NASDAQ:RIOT) You'll Still Get What You Pay For

To the annoyance of some shareholders, Riot Platforms, Inc. (NASDAQ:RIOT) shares are down a considerable 28% in the last month, which continues a horrid run for the company. Looking at the bigger picture, even after this poor month the stock is up 32% in the last year.
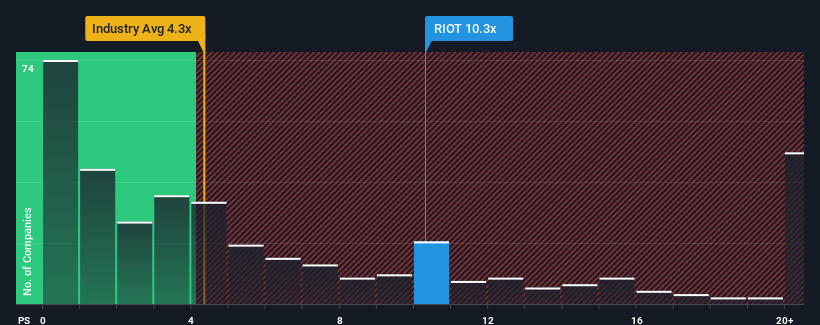
In spite of the heavy fall in price, Riot Platforms may still be sending very bearish signals at the moment with a price-to-sales (or "P/S") ratio of 10.3x, since almost half of all companies in the Software industry in the United States have P/S ratios under 4.3x and even P/S lower than 1.8x are not unusual. Nonetheless, we'd need to dig a little deeper to determine if there is a rational basis for the highly elevated P/S.
See our latest analysis for Riot Platforms
How Has Riot Platforms Performed Recently?
Recent times haven't been great for Riot Platforms as its revenue has been rising slower than most other companies. It might be that many expect the uninspiring revenue performance to recover significantly, which has kept the P/S ratio from collapsing. However, if this isn't the case, investors might get caught out paying too much for the stock.
Want the full picture on analyst estimates for the company? Then our free report on Riot Platforms will help you uncover what's on the horizon.What Are Revenue Growth Metrics Telling Us About The High P/S?
Riot Platforms' P/S ratio would be typical for a company that's expected to deliver very strong growth, and importantly, perform much better than the industry.
If we review the last year of revenue growth, the company posted a worthy increase of 8.3%. The latest three year period has seen an incredible overall rise in revenue, even though the last 12 month performance was only fair. Accordingly, shareholders would have been over the moon with those medium-term rates of revenue growth.
Shifting to the future, estimates from the eleven analysts covering the company suggest revenue should grow by 32% per annum over the next three years. Meanwhile, the rest of the industry is forecast to only expand by 15% per annum, which is noticeably less attractive.
With this in mind, it's not hard to understand why Riot Platforms' P/S is high relative to its industry peers. Apparently shareholders aren't keen to offload something that is potentially eyeing a more prosperous future.
What Does Riot Platforms' P/S Mean For Investors?
A significant share price dive has done very little to deflate Riot Platforms' very lofty P/S. Typically, we'd caution against reading too much into price-to-sales ratios when settling on investment decisions, though it can reveal plenty about what other market participants think about the company.
As we suspected, our examination of Riot Platforms' analyst forecasts revealed that its superior revenue outlook is contributing to its high P/S. It appears that shareholders are confident in the company's future revenues, which is propping up the P/S. It's hard to see the share price falling strongly in the near future under these circumstances.
We don't want to rain on the parade too much, but we did also find 3 warning signs for Riot Platforms (1 is potentially serious!) that you need to be mindful of.
If companies with solid past earnings growth is up your alley, you may wish to see this free collection of other companies with strong earnings growth and low P/E ratios.
New: AI Stock Screener & Alerts
Our new AI Stock Screener scans the market every day to uncover opportunities.
• Dividend Powerhouses (3%+ Yield)
• Undervalued Small Caps with Insider Buying
• High growth Tech and AI Companies
Or build your own from over 50 metrics.
Have feedback on this article? Concerned about the content? Get in touch with us directly. Alternatively, email editorial-team (at) simplywallst.com.
This article by Simply Wall St is general in nature. We provide commentary based on historical data and analyst forecasts only using an unbiased methodology and our articles are not intended to be financial advice. It does not constitute a recommendation to buy or sell any stock, and does not take account of your objectives, or your financial situation. We aim to bring you long-term focused analysis driven by fundamental data. Note that our analysis may not factor in the latest price-sensitive company announcements or qualitative material. Simply Wall St has no position in any stocks mentioned.
About NasdaqCM:RIOT
Riot Platforms
Operates as a Bitcoin mining company in the United States.
Low with imperfect balance sheet.
Similar Companies
Market Insights


Advertisement
Community Narratives
MicroStrategy: Volatile Gamble or Golden Opportunity?
Fair Value US$663.00|32.0% undervalued
BL
Community Contributor
Emerging Markets and Debt Reduction Will Propel Bath & Body Works Forward
Fair Value US$40.73|21.7% undervalued
ZW
Community Contributor
An amazing opportunity to potentially get a 100 bagger
Fair Value US$10.00|0.5% overvalued
DA
Community Contributor