Advertisement
- United States
- /
- IT
- /
- NasdaqGS:PRFT
Why Perficient, Inc.'s (NASDAQ:PRFT) High P/E Ratio Isn't Necessarily A Bad Thing
This article is for investors who would like to improve their understanding of price to earnings ratios (P/E ratios). We'll show how you can use Perficient, Inc.'s (NASDAQ:PRFT) P/E ratio to inform your assessment of the investment opportunity. Perficient has a price to earnings ratio of 38.01, based on the last twelve months. In other words, at today's prices, investors are paying $38.01 for every $1 in prior year profit.
View our latest analysis for Perficient
How Do You Calculate A P/E Ratio?
The formula for P/E is:
Price to Earnings Ratio = Price per Share ÷ Earnings per Share (EPS)
Or for Perficient:
P/E of 38.01 = $28.8 ÷ $0.76 (Based on the trailing twelve months to December 2018.)
Is A High P/E Ratio Good?
A higher P/E ratio means that buyers have to pay a higher price for each $1 the company has earned over the last year. That isn't a good or a bad thing on its own, but a high P/E means that buyers have a higher opinion of the business's prospects, relative to stocks with a lower P/E.
How Growth Rates Impact P/E Ratios
When earnings fall, the 'E' decreases, over time. Therefore, even if you pay a low multiple of earnings now, that multiple will become higher in the future. So while a stock may look cheap based on past earnings, it could be expensive based on future earnings.
Notably, Perficient grew EPS by a whopping 35% in the last year. Unfortunately, earnings per share are down 2.7% a year, over 5 years.
How Does Perficient's P/E Ratio Compare To Its Peers?
The P/E ratio essentially measures market expectations of a company. You can see in the image below that the average P/E (30.6) for companies in the it industry is lower than Perficient's P/E.
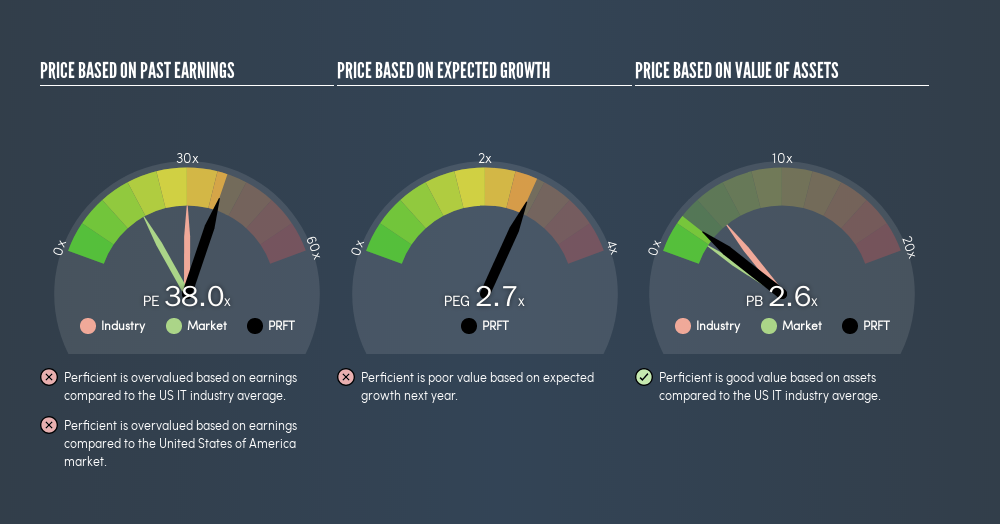
Its relatively high P/E ratio indicates that Perficient shareholders think it will perform better than other companies in its industry classification. The market is optimistic about the future, but that doesn't guarantee future growth. So investors should delve deeper. I like to check if company insiders have been buying or selling.
Don't Forget: The P/E Does Not Account For Debt or Bank Deposits
The 'Price' in P/E reflects the market capitalization of the company. Thus, the metric does not reflect cash or debt held by the company. Theoretically, a business can improve its earnings (and produce a lower P/E in the future), by taking on debt (or spending its remaining cash).
Such expenditure might be good or bad, in the long term, but the point here is that the balance sheet is not reflected by this ratio.
How Does Perficient's Debt Impact Its P/E Ratio?
Perficient has net debt worth just 7.9% of its market capitalization. So it doesn't have as many options as it would with net cash, but its debt would not have much of an impact on its P/E ratio.
The Verdict On Perficient's P/E Ratio
Perficient trades on a P/E ratio of 38, which is above the US market average of 17.5. The company is not overly constrained by its modest debt levels, and it is growing earnings per share. So it does not seem strange that the P/E is above average.
When the market is wrong about a stock, it gives savvy investors an opportunity. If the reality for a company is better than it expects, you can make money by buying and holding for the long term. So this freereport on the analyst consensus forecasts could help you make a master move on this stock.
Of course, you might find a fantastic investment by looking at a few good candidates. So take a peek at this freelist of companies with modest (or no) debt, trading on a P/E below 20.
We aim to bring you long-term focused research analysis driven by fundamental data. Note that our analysis may not factor in the latest price-sensitive company announcements or qualitative material.
If you spot an error that warrants correction, please contact the editor at editorial-team@simplywallst.com. This article by Simply Wall St is general in nature. It does not constitute a recommendation to buy or sell any stock, and does not take account of your objectives, or your financial situation. Simply Wall St has no position in the stocks mentioned. Thank you for reading.
About NasdaqGS:PRFT
Perficient
Provides digital consultancy services and solutions in the United States and internationally.
Mediocre balance sheet and slightly overvalued.
Similar Companies
Market Insights


Advertisement
Weekly Picks
LO


Lou_Basenese on Optimi Health ·
The Only Psychedelic Company Already Selling MDMA and Psilocybin to Real Patients, Yet Priced Like It Doesn’t Exist
Fair Value:US$1157.5% undervalued
35 followersusers have followed this narrative
2 commentsusers have commented on this narrative
6 likesusers have liked this narrative
WE


WealthAP on Novo Nordisk ·
Novo Nordisk (NVO): Is the "Easy Growth" Story Over?
Fair Value:DKK 407.7721.4% undervalued
59 followersusers have followed this narrative
0 commentsusers have commented on this narrative
7 likesusers have liked this narrative
VA


ValueInvestingSubstack on Zoetis ·
Zoetis down -50% over the past year
Fair Value:US$92.9218.9% undervalued
20 followersusers have followed this narrative
0 commentsusers have commented on this narrative
8 likesusers have liked this narrative
CE


CentryResearch on Centrus Energy ·
Centrus Energy: The Next Nuclear Bottleneck Isn't Reactors. It's Fuel.
Fair Value:US$19013.7% undervalued
18 followersusers have followed this narrative
0 commentsusers have commented on this narrative
9 likesusers have liked this narrative
Recently Updated Narratives
AE

Aequitas on ASML Holding ·
ASML Will Reign as the Kingpin of the Semiconductor Supply Chain
Fair Value:€1.87k16.5% undervalued
1 followerusers have followed this narrative
0 commentsusers have commented on this narrative
0 likesusers have liked this narrative
AE

Aequitas on Fortinet ·
Fortinet, compounding Cyber Security Player.
Fair Value:US$116.8430.4% overvalued
1 followerusers have followed this narrative
0 commentsusers have commented on this narrative
0 likesusers have liked this narrative
AE

Aequitas on Constellation Software ·
Constellation Software: A Proven Serial Acquirer at a Discount
Fair Value:CA$3.72k28.3% undervalued
1 followerusers have followed this narrative
0 commentsusers have commented on this narrative
0 likesusers have liked this narrative
Popular Narratives
BE

benjamin_lvieq on PayPal Holdings ·
PayPal: PayPal Doesn't Need to Grow – It Needs to Stop Falling – A Mispriced Cash Machine With a Cannibal Buyback
Fair Value:US$6513.6% undervalued
70 followersusers have followed this narrative
2 commentsusers have commented on this narrative
11 likesusers have liked this narrative
CU

CubanEros on Microsoft ·
A wonderful business at reasonable price.
Fair Value:US$419.919.1% undervalued
69 followersusers have followed this narrative
0 commentsusers have commented on this narrative
5 likesusers have liked this narrative
TR


tripledub on Alphabet ·
Warren Buffett Just Bet $10 Billion on Google. The Catch? You May Already Be Too Late.
Fair Value:US$23039.0% overvalued
91 followersusers have followed this narrative
1 commentusers have commented on this narrative
18 likesusers have liked this narrative