
Dave Inc.'s (NASDAQ:DAVE) robust earnings report didn't manage to move the market for its stock. Our analysis suggests that shareholders have noticed something concerning in the numbers.
View our latest analysis for Dave
Zooming In On Dave's Earnings
One key financial ratio used to measure how well a company converts its profit to free cash flow (FCF) is the accrual ratio. In plain english, this ratio subtracts FCF from net profit, and divides that number by the company's average operating assets over that period. This ratio tells us how much of a company's profit is not backed by free cashflow.
As a result, a negative accrual ratio is a positive for the company, and a positive accrual ratio is a negative. While it's not a problem to have a positive accrual ratio, indicating a certain level of non-cash profits, a high accrual ratio is arguably a bad thing, because it indicates paper profits are not matched by cash flow. That's because some academic studies have suggested that high accruals ratios tend to lead to lower profit or less profit growth.
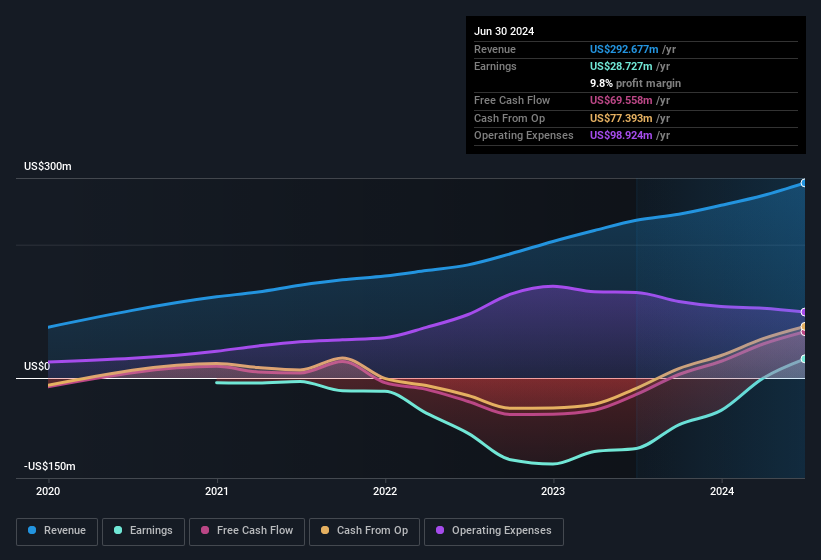
Over the twelve months to June 2024, Dave recorded an accrual ratio of -0.38. Therefore, its statutory earnings were very significantly less than its free cashflow. To wit, it produced free cash flow of US$70m during the period, dwarfing its reported profit of US$28.7m. Given that Dave had negative free cash flow in the prior corresponding period, the trailing twelve month resul of US$70m would seem to be a step in the right direction. Having said that, there is more to consider. We can look at how unusual items in the profit and loss statement impacted its accrual ratio, as well as explore how dilution is impacting shareholders negatively.
That might leave you wondering what analysts are forecasting in terms of future profitability. Luckily, you can click here to see an interactive graph depicting future profitability, based on their estimates.
In order to understand the potential for per share returns, it is essential to consider how much a company is diluting shareholders. As it happens, Dave issued 6.6% more new shares over the last year. That means its earnings are split among a greater number of shares. To celebrate net income while ignoring dilution is like rejoicing because you have a single slice of a larger pizza, but ignoring the fact that the pizza is now cut into many more slices. You can see a chart of Dave's EPS by clicking here.
How Is Dilution Impacting Dave's Earnings Per Share (EPS)?
Three years ago, Dave lost money. Zooming in to the last year, we still can't talk about growth rates coherently, since it made a loss last year. But mathematics aside, it is always good to see when a formerly unprofitable business come good (though we accept profit would have been higher if dilution had not been required). So you can see that the dilution has had a bit of an impact on shareholders.
If Dave's EPS can grow over time then that drastically improves the chances of the share price moving in the same direction. However, if its profit increases while its earnings per share stay flat (or even fall) then shareholders might not see much benefit. For the ordinary retail shareholder, EPS is a great measure to check your hypothetical "share" of the company's profit.
How Do Unusual Items Influence Profit?
Surprisingly, given Dave's accrual ratio implied strong cash conversion, its paper profit was actually boosted by US$33m in unusual items. While it's always nice to have higher profit, a large contribution from unusual items sometimes dampens our enthusiasm. When we crunched the numbers on thousands of publicly listed companies, we found that a boost from unusual items in a given year is often not repeated the next year. And that's as you'd expect, given these boosts are described as 'unusual'. We can see that Dave's positive unusual items were quite significant relative to its profit in the year to June 2024. As a result, we can surmise that the unusual items are making its statutory profit significantly stronger than it would otherwise be.
Our Take On Dave's Profit Performance
In conclusion, Dave's accrual ratio suggests its earnings are well backed by cash but its boost from unusual items is probably not going to be repeated consistently. Further, the dilution means profits are now split more ways. After taking into account all the aforementioned observations we think that Dave's profits probably give a generous impression of its sustainable level of profitability. In light of this, if you'd like to do more analysis on the company, it's vital to be informed of the risks involved. In terms of investment risks, we've identified 3 warning signs with Dave, and understanding them should be part of your investment process.
In this article we've looked at a number of factors that can impair the utility of profit numbers, and we've come away cautious. But there are plenty of other ways to inform your opinion of a company. Some people consider a high return on equity to be a good sign of a quality business. While it might take a little research on your behalf, you may find this free collection of companies boasting high return on equity, or this list of stocks with significant insider holdings to be useful.
The New Payments ETF Is Live on NASDAQ:
Money is moving to real-time rails, and a newly listed ETF now gives investors direct exposure. Fast settlement. Institutional custody. Simple access.
Explore how this launch could reshape portfolios
Sponsored ContentNew: Manage All Your Stock Portfolios in One Place
We've created the ultimate portfolio companion for stock investors, and it's free.
• Connect an unlimited number of Portfolios and see your total in one currency
• Be alerted to new Warning Signs or Risks via email or mobile
• Track the Fair Value of your stocks
Have feedback on this article? Concerned about the content? Get in touch with us directly. Alternatively, email editorial-team (at) simplywallst.com.
This article by Simply Wall St is general in nature. We provide commentary based on historical data and analyst forecasts only using an unbiased methodology and our articles are not intended to be financial advice. It does not constitute a recommendation to buy or sell any stock, and does not take account of your objectives, or your financial situation. We aim to bring you long-term focused analysis driven by fundamental data. Note that our analysis may not factor in the latest price-sensitive company announcements or qualitative material. Simply Wall St has no position in any stocks mentioned.
About NasdaqGM:DAVE
Dave
Provides various financial products and services through its financial services platform in the United States.
Outstanding track record with excellent balance sheet.
Similar Companies
Market Insights

Weekly Picks

Early mover in a fast growing industry. Likely to experience share price volatility as they scale


A case for CA$31.80 (undiluted), aka 8,616% upside from CA$0.37 (an 86 bagger!).


Moderation and Stabilisation: HOLD: Fair Price based on a 4-year Cycle is $12.08
Recently Updated Narratives


Title: Market Sentiment Is Dead Wrong — Here's Why PSEC Deserves a Second Look


An amazing opportunity to potentially get a 100 bagger

Amazon: Why the World’s Biggest Platform Still Runs on Invisible Economics
Popular Narratives


Crazy Undervalued 42 Baggers Silver Play (Active & Running Mine)


MicroVision will explode future revenue by 380.37% with a vision towards success


NVDA: Expanding AI Demand Will Drive Major Data Center Investments Through 2026
Trending Discussion
