
Advertisement
- United States
- /
- Software
- /
- NasdaqGS:CYBR
Are CyberArk Software Ltd.’s (NASDAQ:CYBR) Returns Worth Your While?
Today we'll evaluate CyberArk Software Ltd. (NASDAQ:CYBR) to determine whether it could have potential as an investment idea. Specifically, we'll consider its Return On Capital Employed (ROCE), since that will give us an insight into how efficiently the business can generate profits from the capital it requires.
First, we'll go over how we calculate ROCE. Next, we'll compare it to others in its industry. Last but not least, we'll look at what impact its current liabilities have on its ROCE.
Return On Capital Employed (ROCE): What is it?
ROCE measures the 'return' (pre-tax profit) a company generates from capital employed in its business. Generally speaking a higher ROCE is better. Overall, it is a valuable metric that has its flaws. Renowned investment researcher Michael Mauboussin has suggested that a high ROCE can indicate that 'one dollar invested in the company generates value of more than one dollar'.
How Do You Calculate Return On Capital Employed?
The formula for calculating the return on capital employed is:
Return on Capital Employed = Earnings Before Interest and Tax (EBIT) ÷ (Total Assets - Current Liabilities)
Or for CyberArk Software:
0.10 = US$67m ÷ (US$828m - US$165m) (Based on the trailing twelve months to September 2019.)
So, CyberArk Software has an ROCE of 10%.
View our latest analysis for CyberArk Software
Is CyberArk Software's ROCE Good?
One way to assess ROCE is to compare similar companies. We can see CyberArk Software's ROCE is around the 9.8% average reported by the Software industry. Separate from CyberArk Software's performance relative to its industry, its ROCE in absolute terms looks satisfactory, and it may be worth researching in more depth.
You can click on the image below to see (in greater detail) how CyberArk Software's past growth compares to other companies.
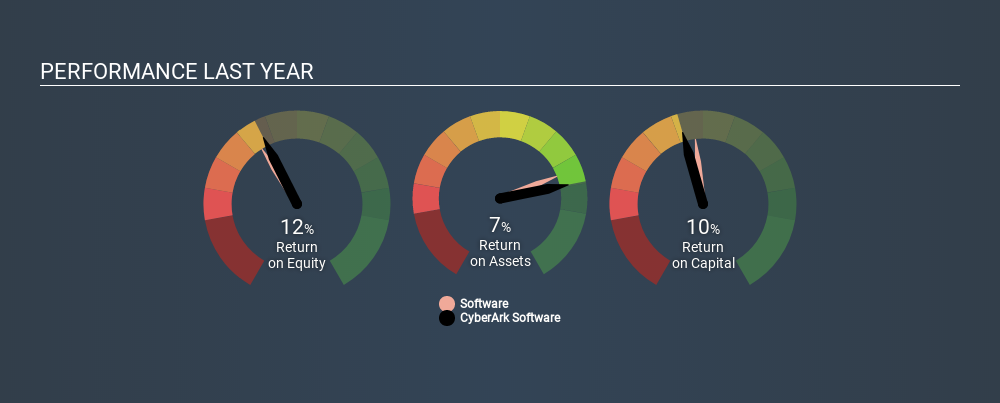
Remember that this metric is backwards looking - it shows what has happened in the past, and does not accurately predict the future. ROCE can be deceptive for cyclical businesses, as returns can look incredible in boom times, and terribly low in downturns. This is because ROCE only looks at one year, instead of considering returns across a whole cycle. Future performance is what matters, and you can see analyst predictions in our free report on analyst forecasts for the company.
How CyberArk Software's Current Liabilities Impact Its ROCE
Short term (or current) liabilities, are things like supplier invoices, overdrafts, or tax bills that need to be paid within 12 months. The ROCE equation subtracts current liabilities from capital employed, so a company with a lot of current liabilities appears to have less capital employed, and a higher ROCE than otherwise. To counteract this, we check if a company has high current liabilities, relative to its total assets.
CyberArk Software has total liabilities of US$165m and total assets of US$828m. As a result, its current liabilities are equal to approximately 20% of its total assets. A fairly low level of current liabilities is not influencing the ROCE too much.
What We Can Learn From CyberArk Software's ROCE
Overall, CyberArk Software has a decent ROCE and could be worthy of further research. There might be better investments than CyberArk Software out there, but you will have to work hard to find them . These promising businesses with rapidly growing earnings might be right up your alley.
If you are like me, then you will not want to miss this free list of growing companies that insiders are buying.
If you spot an error that warrants correction, please contact the editor at editorial-team@simplywallst.com. This article by Simply Wall St is general in nature. It does not constitute a recommendation to buy or sell any stock, and does not take account of your objectives, or your financial situation. Simply Wall St has no position in the stocks mentioned.
We aim to bring you long-term focused research analysis driven by fundamental data. Note that our analysis may not factor in the latest price-sensitive company announcements or qualitative material. Thank you for reading.
MI

The Foxhole
Nvidia's (NVDA) record profit had a US$7.8 billion catch. That chunk came from betting on its own customers, not from selling its chips.
66
 Mitchell Lawler
Market Insights
Which payment stocks actually get paid?

Every new payment app was supposed to kill Visa and Mastercard. Instead, they got bigger. So what does that mean for the payment stocks on your radar?
43
About NasdaqGS:CYBR
CyberArk Software
Develops, markets, and sells software-based identity security solutions and services in the United States, Israel, the United Kingdom, Europe, the Middle East, Africa, and internationally.
Flawless balance sheet with reasonable growth potential.
Similar Companies
Market Insights


Advertisement
Weekly Picks
RI


Rick_Orford on Starfighters Space ·
The 1960s Fighter Jet That Could Crack Open a $20 Billion Satellite Market
Fair Value:US$522.6% undervalued
72 followersusers have followed this narrative
4 commentsusers have commented on this narrative
11 likesusers have liked this narrative
TR


tripledub on Meta Platforms ·
The $135 Billion Bet That Should Make Every Shareholder Nervous
Fair Value:US$5861.7% undervalued
57 followersusers have followed this narrative
3 commentsusers have commented on this narrative
34 likesusers have liked this narrative
TA


Talos on Voyager Technologies ·
The "Landlord of Orbit" – A Deep Value Play Ahead of the Starlab Era
Fair Value:US$385.291.0% undervalued
50 followersusers have followed this narrative
0 commentsusers have commented on this narrative
5 likesusers have liked this narrative
IV

Ivoed on Uber Technologies ·
Uber’s Valuation Depends On Who Captures The Economics Of Driverless Rides
Fair Value:US$11632.3% undervalued
12 followersusers have followed this narrative
0 commentsusers have commented on this narrative
3 likesusers have liked this narrative
Recently Updated Narratives
RO


RockeTeller on Eloro Resources ·
Eloro Resources, 350 Million Ounces of Silver for Just $285M Market Cap, The Mathematics Don’t Add Up
Fair Value:CA$78.1597.3% undervalued
1 followerusers have followed this narrative
0 commentsusers have commented on this narrative
0 likesusers have liked this narrative
TI


tinyvalueinvestor on Harvest Miracle Capital Berhad ·
Harvest Miracle Capital Posts 358% Profit Growth as Core Divisions Gain Traction
Fair Value:RM 1.6391.4% undervalued
1 followerusers have followed this narrative
0 commentsusers have commented on this narrative
0 likesusers have liked this narrative
TI

tinyvalueinvestor on Kee Ming Group Berhad ·
Kee Ming Opens FY2027 with Higher Revenue and a Stronger RM206.4 Million Order Book
Fair Value:RM 2.9814.4% undervalued
1 followerusers have followed this narrative
0 commentsusers have commented on this narrative
0 likesusers have liked this narrative
Popular Narratives
OS


oscargarcia on NVIDIA ·
The company that went from selling GPUs to gamers to becoming the AI arms dealer of the 21st century.
Fair Value:US$28025.1% undervalued
362 followersusers have followed this narrative
9 commentsusers have commented on this narrative
16 likesusers have liked this narrative
CU

CubanEros on Microsoft ·
A wonderful business at reasonable price.
Fair Value:US$419.9118.2% overvalued
209 followersusers have followed this narrative
0 commentsusers have commented on this narrative
9 likesusers have liked this narrative
KI

KiwiInvest on Amazon.com ·
Amazon's high growth, high tech segments propel its profits, while traditional segments plod along
Fair Value:US$475.0945.2% undervalued
234 followersusers have followed this narrative
1 commentusers have commented on this narrative
8 likesusers have liked this narrative


