
Advertisement
- United States
- /
- Software
- /
- NasdaqGS:CRNC
Cerence Inc. (NASDAQ:CRNC) Looks Inexpensive After Falling 31% But Perhaps Not Attractive Enough
Cerence Inc. (NASDAQ:CRNC) shareholders won't be pleased to see that the share price has had a very rough month, dropping 31% and undoing the prior period's positive performance. For any long-term shareholders, the last month ends a year to forget by locking in a 88% share price decline.
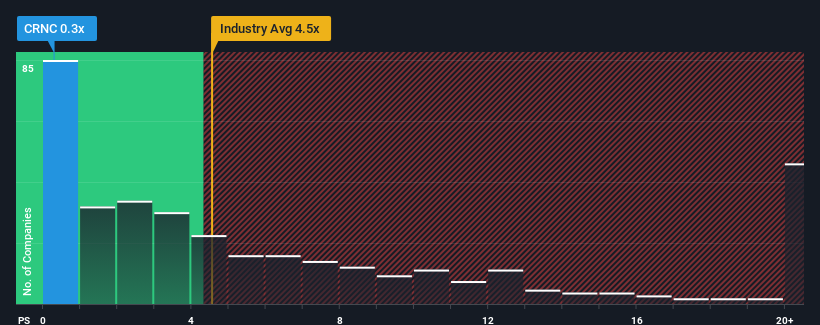
After such a large drop in price, Cerence may be sending very bullish signals at the moment with its price-to-sales (or "P/S") ratio of 0.3x, since almost half of all companies in the Software industry in the United States have P/S ratios greater than 4.5x and even P/S higher than 11x are not unusual. Nonetheless, we'd need to dig a little deeper to determine if there is a rational basis for the highly reduced P/S.
Check out our latest analysis for Cerence
How Cerence Has Been Performing
Recent times have been advantageous for Cerence as its revenues have been rising faster than most other companies. One possibility is that the P/S ratio is low because investors think this strong revenue performance might be less impressive moving forward. If not, then existing shareholders have reason to be quite optimistic about the future direction of the share price.
Want the full picture on analyst estimates for the company? Then our free report on Cerence will help you uncover what's on the horizon.How Is Cerence's Revenue Growth Trending?
There's an inherent assumption that a company should far underperform the industry for P/S ratios like Cerence's to be considered reasonable.
If we review the last year of revenue growth, the company posted a terrific increase of 31%. Despite this strong recent growth, it's still struggling to catch up as its three-year revenue frustratingly shrank by 6.0% overall. Accordingly, shareholders would have felt downbeat about the medium-term rates of revenue growth.
Turning to the outlook, the next three years should bring diminished returns, with revenue decreasing 8.2% each year as estimated by the eight analysts watching the company. Meanwhile, the broader industry is forecast to expand by 19% per year, which paints a poor picture.
With this in consideration, we find it intriguing that Cerence's P/S is closely matching its industry peers. Nonetheless, there's no guarantee the P/S has reached a floor yet with revenue going in reverse. Even just maintaining these prices could be difficult to achieve as the weak outlook is weighing down the shares.
What Does Cerence's P/S Mean For Investors?
Cerence's P/S looks about as weak as its stock price lately. Using the price-to-sales ratio alone to determine if you should sell your stock isn't sensible, however it can be a practical guide to the company's future prospects.
As we suspected, our examination of Cerence's analyst forecasts revealed that its outlook for shrinking revenue is contributing to its low P/S. As other companies in the industry are forecasting revenue growth, Cerence's poor outlook justifies its low P/S ratio. Unless these conditions improve, they will continue to form a barrier for the share price around these levels.
It is also worth noting that we have found 2 warning signs for Cerence that you need to take into consideration.
It's important to make sure you look for a great company, not just the first idea you come across. So if growing profitability aligns with your idea of a great company, take a peek at this free list of interesting companies with strong recent earnings growth (and a low P/E).
New: AI Stock Screener & Alerts
Our new AI Stock Screener scans the market every day to uncover opportunities.
• Dividend Powerhouses (3%+ Yield)
• Undervalued Small Caps with Insider Buying
• High growth Tech and AI Companies
Or build your own from over 50 metrics.
Have feedback on this article? Concerned about the content? Get in touch with us directly. Alternatively, email editorial-team (at) simplywallst.com.
This article by Simply Wall St is general in nature. We provide commentary based on historical data and analyst forecasts only using an unbiased methodology and our articles are not intended to be financial advice. It does not constitute a recommendation to buy or sell any stock, and does not take account of your objectives, or your financial situation. We aim to bring you long-term focused analysis driven by fundamental data. Note that our analysis may not factor in the latest price-sensitive company announcements or qualitative material. Simply Wall St has no position in any stocks mentioned.
About NasdaqGS:CRNC
Cerence
Provides AI powered virtual assistants for the mobility/transportation market in the United States, rest of the Americas, Germany, rest of Europe, the Middle East, Africa, Japan, and rest of the Asia-Pacific.
Fair value with moderate growth potential.
Similar Companies
Market Insights

Advertisement
Community Narratives
MicroVision will explode future revenue by 380.37% with a vision towards success
Fair Value US$60.00|98.5% undervalued
TH
Community Contributor
The Indispensable Artery for a New North American Economy
Fair Value CA$132.87|2.3% undervalued
TI
Community Contributor