- United States
- /
- Semiconductors
- /
- NasdaqGS:QCOM
Does Qualcomm’s AI Chip Upgrade Signal Value After 7.6% Stock Rally in 2025?

Reviewed by Bailey Pemberton
Trying to decide what to do with QUALCOMM stock right now? You are not alone. With the share price settling at $169.18 after a recent 7.6% climb over the last month and a year-to-date gain of 10.1%, QUALCOMM is once again turning heads in the semiconductor sector. The one-year return of 2.4% might not dazzle, but the three- and five-year returns, both sitting around 50%, should remind anyone not to count out this tech heavyweight too soon.
So what has the market buzzing about QUALCOMM? It is not just the solid long-term gains. QUALCOMM’s chips have just adopted the latest Arm architecture designed to boost AI performance, potentially leveling up its ability to compete with MediaTek and Apple. Meanwhile, the broader chip industry is being shaken up by US efforts to bring manufacturing stateside, with policy discussions and possible tariffs grabbing headlines. It is a landscape full of opportunity and risk, the kind of environment where QUALCOMM has shown it can adapt and thrive.
If you are wondering about value, QUALCOMM’s current valuation score is a 4 out of 6. That means the company is coming up undervalued in four key valuation checks, which could be promising for investors hunting for bargains but is not a slam dunk in every category. Next, we will break down what those valuation approaches really mean, and later, we will look at an even smarter way to get to the heart of QUALCOMM’s true worth.
Why QUALCOMM is lagging behind its peers
Approach 1: QUALCOMM Discounted Cash Flow (DCF) Analysis
The Discounted Cash Flow (DCF) model is a fundamental valuation tool that estimates what a company is worth today by projecting its future cash flows and discounting them back to present value. This method helps investors gauge a company’s intrinsic value based on expected long-term cash generation, rather than focusing solely on short-term earnings.
QUALCOMM’s latest reported Free Cash Flow stands at $11.25 Billion. According to analyst forecasts, QUALCOMM’s annual Free Cash Flow is expected to grow steadily, reaching as much as $21.08 Billion by 2035. For the first five years, projections rely on analyst estimates; after this period, Simply Wall St extrapolates further growth to extend the outlook over a full decade.
The resulting DCF analysis determines QUALCOMM’s fair intrinsic value as $194.66 per share, which is 13.1% higher than its current market price of $169.18. This suggests that, based on conservative cash flow projections, QUALCOMM stock may be undervalued and could present an opportunity for investors who believe in its growth prospects.
Result: UNDERVALUED
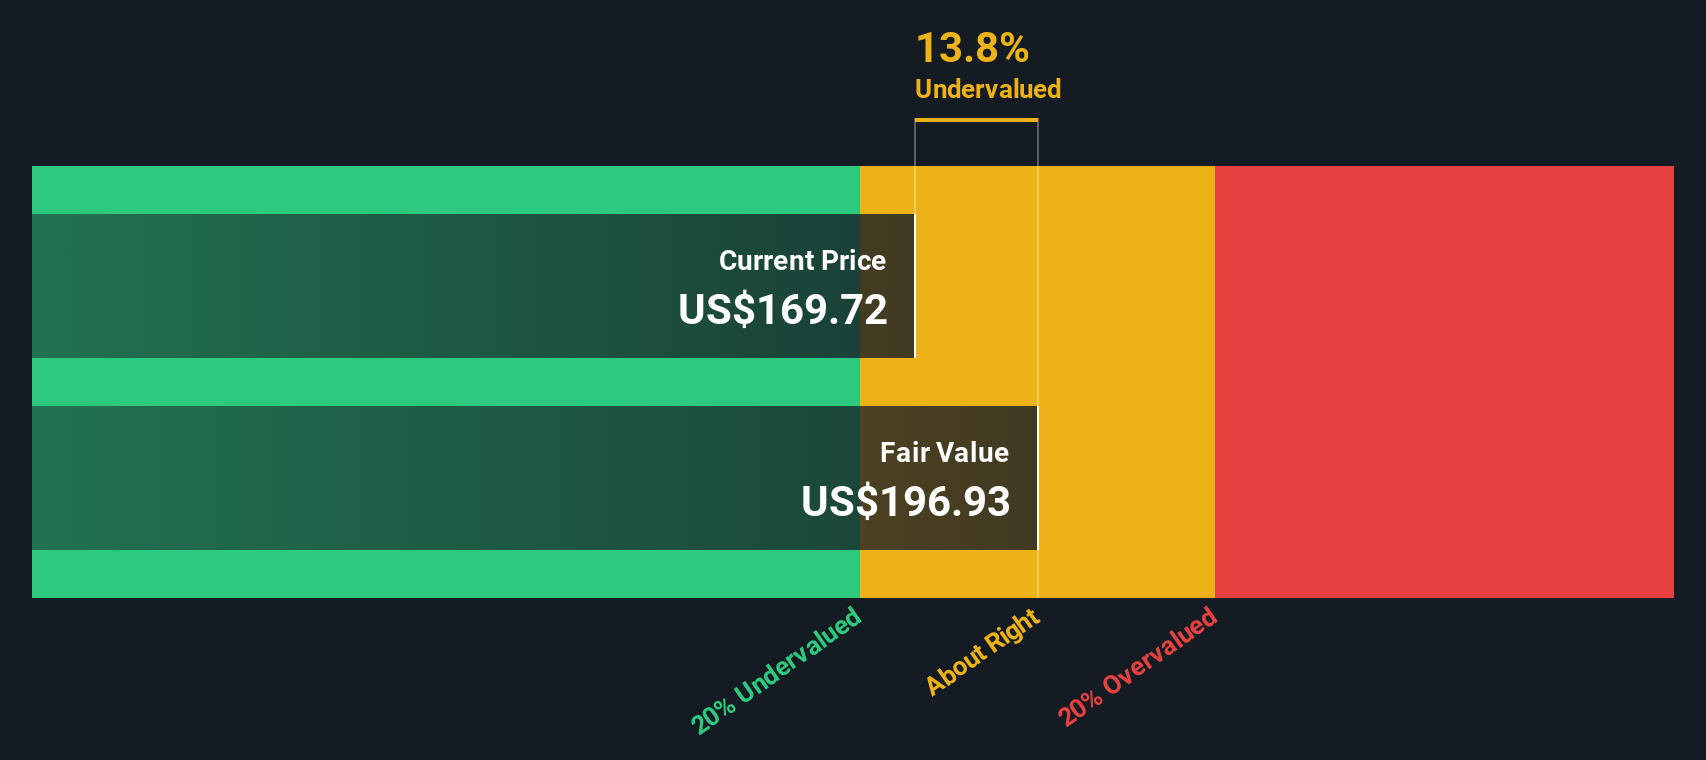
Our Discounted Cash Flow (DCF) analysis suggests QUALCOMM is undervalued by 13.1%. Track this in your watchlist or portfolio, or discover more undervalued stocks.
Approach 2: QUALCOMM Price vs Earnings
The Price-to-Earnings (PE) ratio is a popular and effective valuation tool for assessing profitable companies like QUALCOMM. This metric captures how much investors are willing to pay for each dollar of earnings, making it particularly useful for established firms with steady profits.
Growth expectations play a major role in determining what a fair PE ratio should be. High-growth companies typically command higher PE multiples, as investors expect faster earnings expansion in the future. On the other side, elevated risks or slower growth tend to justify lower PE ratios, as investors factor in more uncertainty or less upside potential.
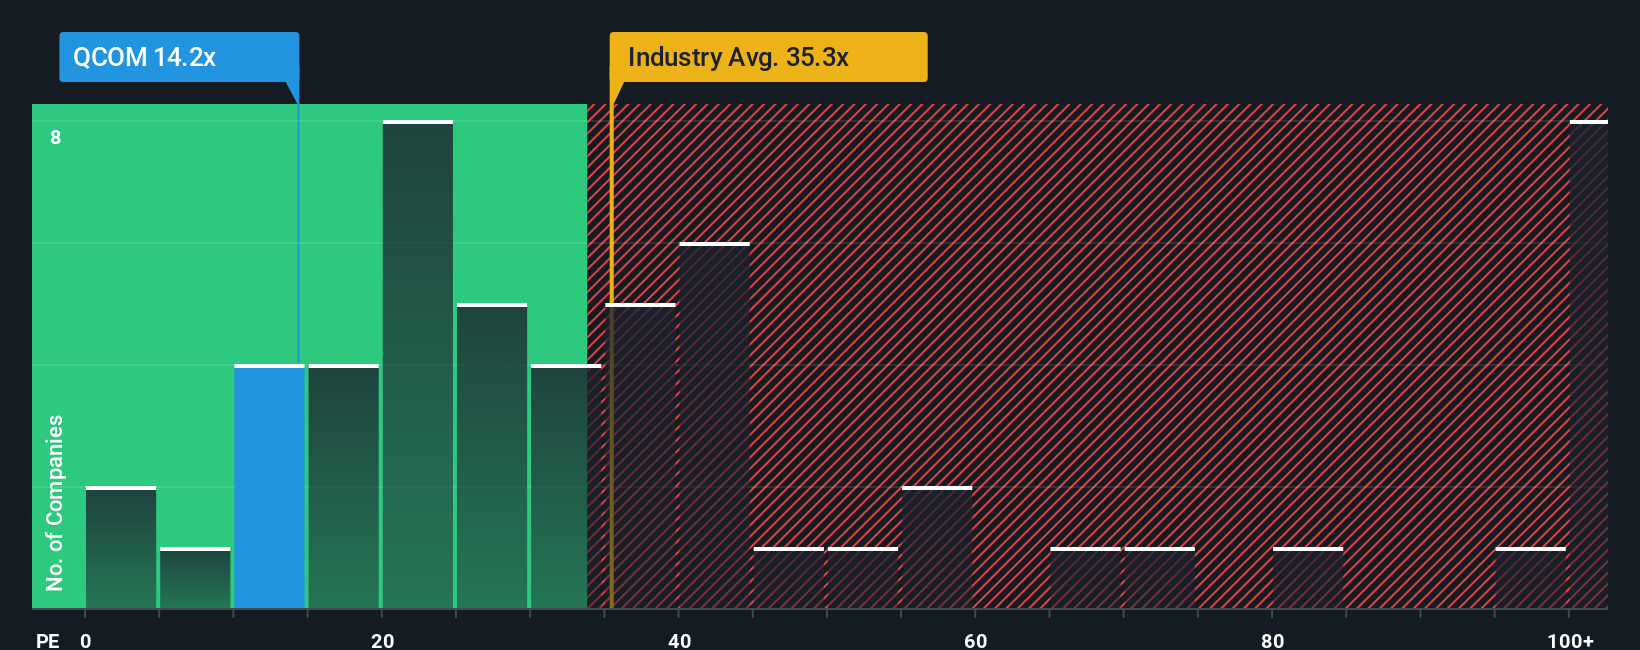
QUALCOMM is currently trading at a PE ratio of 15.7x. For context, this is significantly lower than both the semiconductor industry average PE of 37.0x and its peer average of 54.0x. At first glance, this might suggest that QUALCOMM is undervalued relative to both the broader sector and direct competitors.
However, Simply Wall St’s “Fair Ratio” provides a more nuanced benchmark. The Fair Ratio for QUALCOMM is 27.2x, which reflects not only industry dynamics and profit margins but also the company’s expected growth, market cap, and unique risk profile. This approach moves beyond simple peer or sector comparisons by incorporating a wider set of company-specific factors for a more tailored view of value.
Comparing QUALCOMM’s current PE of 15.7x to its Fair Ratio of 27.2x indicates the stock is undervalued based on its current fundamentals and outlook.
Result: UNDERVALUED
PE ratios tell one story, but what if the real opportunity lies elsewhere? Discover companies where insiders are betting big on explosive growth.
Upgrade Your Decision Making: Choose your QUALCOMM Narrative
Earlier we mentioned that there is an even better way to understand valuation. Let’s introduce you to Narratives. A Narrative is a simple but powerful tool that lets you describe the story you see behind a company, shaping your own view of its future by connecting your expectations for revenue, profit margins, and growth with a fair value estimate, all in one place.
Narratives allow you to link QUALCOMM’s business updates and strategy with financial forecasts, creating a clear bridge between the company’s story and its share price. They are easy to use and available for everyone on Simply Wall St’s Community page, where millions of investors create, share, and refine their own perspectives as new information comes in, including earnings reports or major news headlines.
By building or following a Narrative, you can readily see if you believe QUALCOMM’s stock is a buy or a sell based on your fair value compared to today’s price. You can update your view as soon as circumstances change, keeping your decision-making dynamic and current.
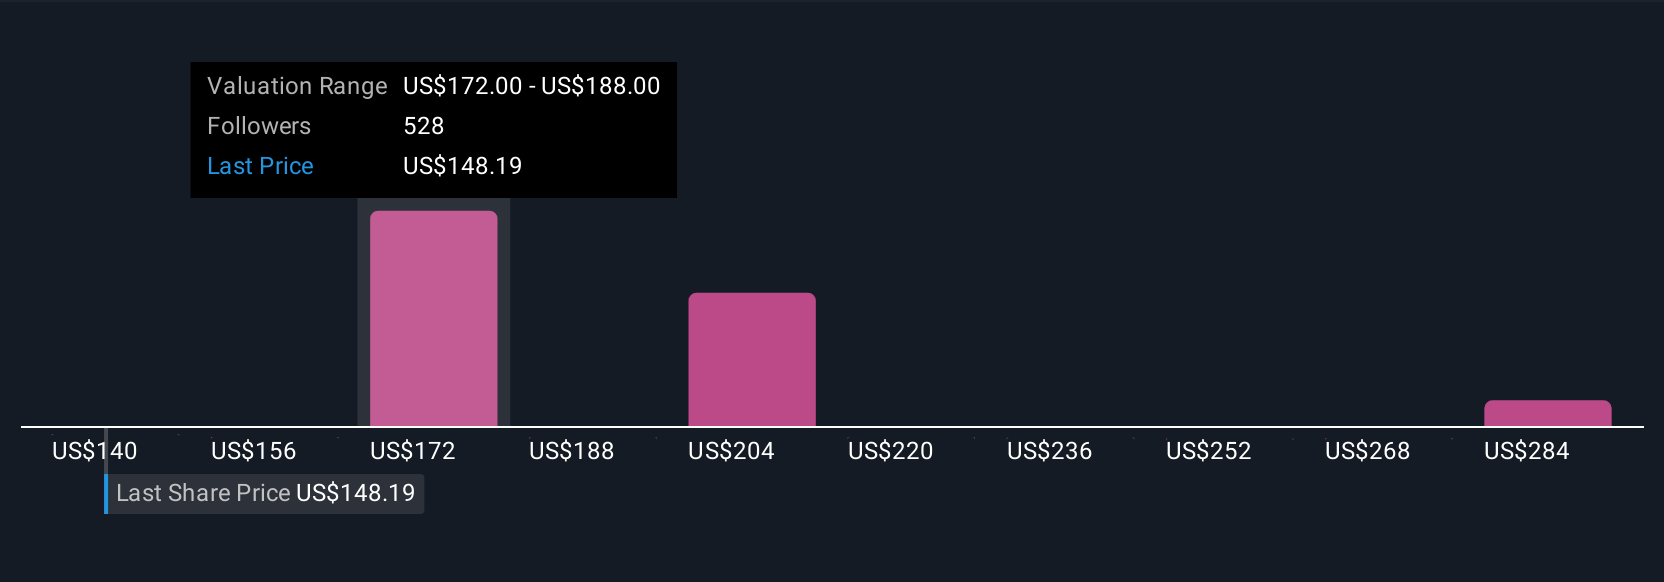
For example, one investor’s Narrative might forecast strong multi-year growth and a $300 fair value for QUALCOMM, while another projects slower expansion and a fair value closer to $140. Narratives empower you to follow the outlook that fits your own conviction.
Do you think there's more to the story for QUALCOMM? Create your own Narrative to let the Community know!
This article by Simply Wall St is general in nature. We provide commentary based on historical data and analyst forecasts only using an unbiased methodology and our articles are not intended to be financial advice. It does not constitute a recommendation to buy or sell any stock, and does not take account of your objectives, or your financial situation. We aim to bring you long-term focused analysis driven by fundamental data. Note that our analysis may not factor in the latest price-sensitive company announcements or qualitative material. Simply Wall St has no position in any stocks mentioned.
The New Payments ETF Is Live on NASDAQ:
Money is moving to real-time rails, and a newly listed ETF now gives investors direct exposure. Fast settlement. Institutional custody. Simple access.
Explore how this launch could reshape portfolios
Sponsored ContentValuation is complex, but we're here to simplify it.
Discover if QUALCOMM might be undervalued or overvalued with our detailed analysis, featuring fair value estimates, potential risks, dividends, insider trades, and its financial condition.
Access Free AnalysisHave feedback on this article? Concerned about the content? Get in touch with us directly. Alternatively, email editorial-team@simplywallst.com
About NasdaqGS:QCOM
QUALCOMM
Engages in the development and commercialization of foundational technologies for the wireless industry worldwide.
Flawless balance sheet established dividend payer.
Similar Companies
Market Insights


Weekly Picks

Early mover in a fast growing industry. Likely to experience share price volatility as they scale


A case for CA$31.80 (undiluted), aka 8,616% upside from CA$0.37 (an 86 bagger!).


Moderation and Stabilisation: HOLD: Fair Price based on a 4-year Cycle is $12.08
Recently Updated Narratives

Airbnb Stock: Platform Growth in a World of Saturation and Scrutiny

Adobe Stock: AI-Fueled ARR Growth Pushes Guidance Higher, But Cost Pressures Loom

Thomson Reuters Stock: When Legal Intelligence Becomes Mission-Critical Infrastructure
Popular Narratives


Crazy Undervalued 42 Baggers Silver Play (Active & Running Mine)


NVDA: Expanding AI Demand Will Drive Major Data Center Investments Through 2026

The AI Infrastructure Giant Grows Into Its Valuation
Trending Discussion


