Advertisement
- United States
- /
- Semiconductors
- /
- NasdaqGS:QCOM
Assessing Qualcomm (QCOM) After Recent Share Price Pullback In Chip Sector Repricing

Reviewed by Bailey Pemberton
- If you are wondering whether QUALCOMM is priced fairly or if the recent pullback has created an opportunity, this article walks through the key numbers so you can judge the current price for yourself.
- After a 7 day return of an 8.7% decline and a 30 day return of an 8.2% decline, QUALCOMM now sits at a last close of US$164.54, with returns of a 4.9% decline year to date, 2.3% over 1 year, 44.3% over 3 years, and 11.3% over 5 years.
- Recent headlines around QUALCOMM have focused on its role in semiconductors and wireless technology, alongside broader attention on how chip related stocks are being priced. This context has helped frame the recent price moves as investors reassess growth potential and risk for the sector.
- QUALCOMM currently has a valuation score of 4 out of 6, which means it screens as undervalued on four of our checks. Next, we will look at how different valuation methods assess the stock and then finish with a way of thinking about value that can tie these approaches together.
Find out why QUALCOMM's 2.3% return over the last year is lagging behind its peers.
Approach 1: QUALCOMM Discounted Cash Flow (DCF) Analysis
A Discounted Cash Flow model takes the cash QUALCOMM is expected to generate in the future and then discounts those cash flows back to today to estimate what the business could be worth right now.
QUALCOMM’s latest twelve month free cash flow is about US$12.6b. The DCF model used here is a 2 Stage Free Cash Flow to Equity approach, which incorporates analyst estimates for the next few years and then extrapolates further using more moderate assumptions. On this basis, projected free cash flow for 2030 is US$15.2b, with intermediate years such as 2026 and 2027 sitting in the US$12.8b to US$13.1b range. Simply Wall St then discounts each of these projected cash flows back to today using its chosen discount rate.
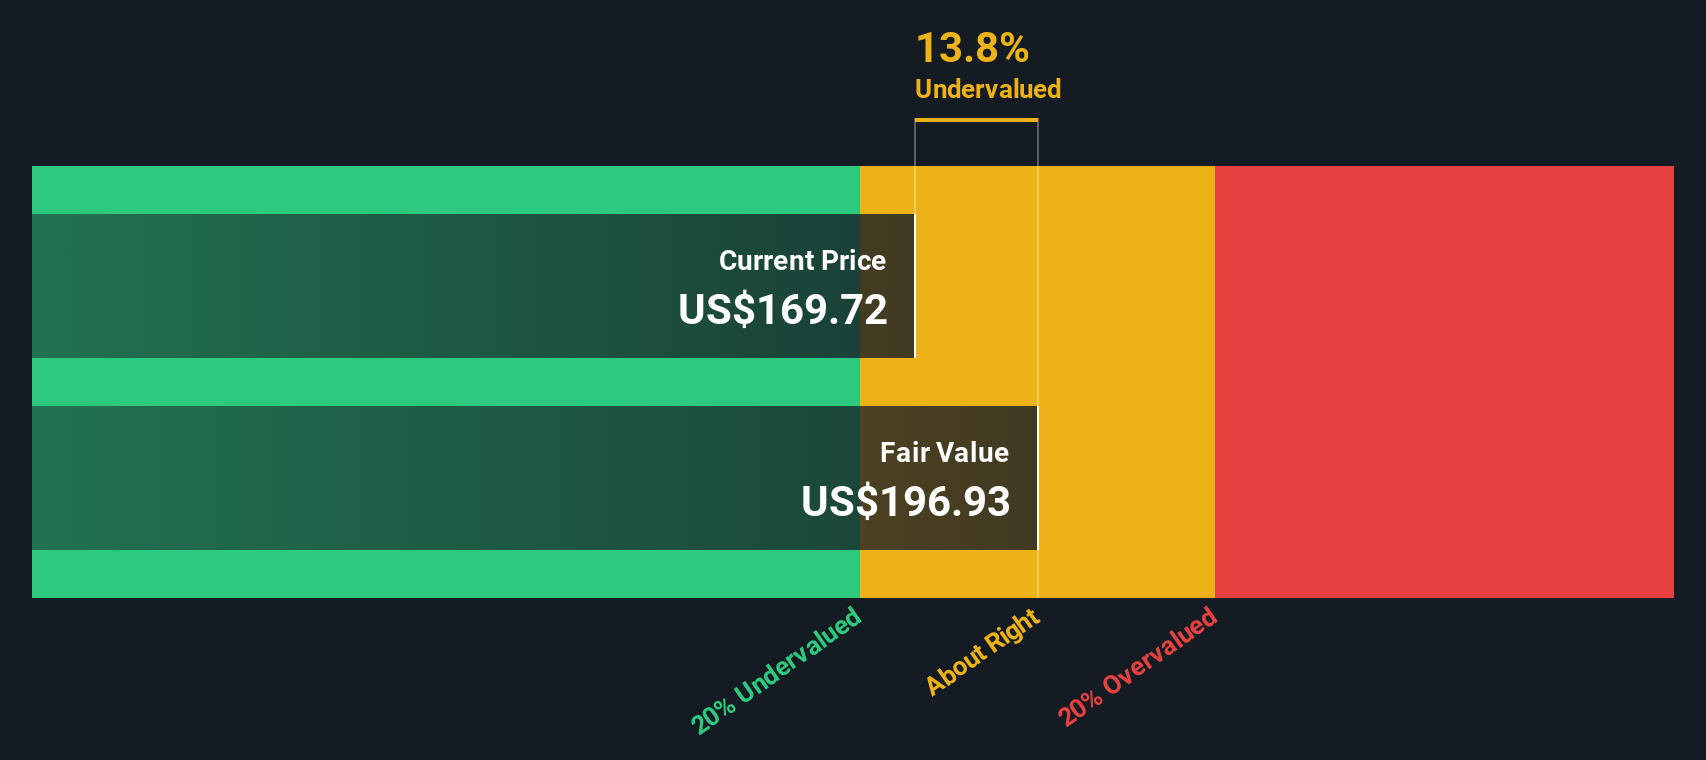
Putting those projections together gives an estimated intrinsic value of US$165.02 per share. Compared with the recent share price of US$164.54, the model suggests QUALCOMM is about 0.3% undervalued, which is effectively a match between price and the cash flow based estimate.
Result: ABOUT RIGHT
QUALCOMM is fairly valued according to our Discounted Cash Flow (DCF), but this can change at a moment's notice. Track the value in your watchlist or portfolio and be alerted on when to act.
Approach 2: QUALCOMM Price vs Earnings
For a profitable company like QUALCOMM, the P/E ratio is a useful shorthand for how much investors are paying for each dollar of earnings. It ties the share price directly to the bottom line, which is usually what you are ultimately buying.
What counts as a “normal” P/E depends on how the market views a company’s growth potential and risk. Higher expected growth or lower perceived risk can justify a higher multiple, while slower growth or higher risk tends to pull it down.
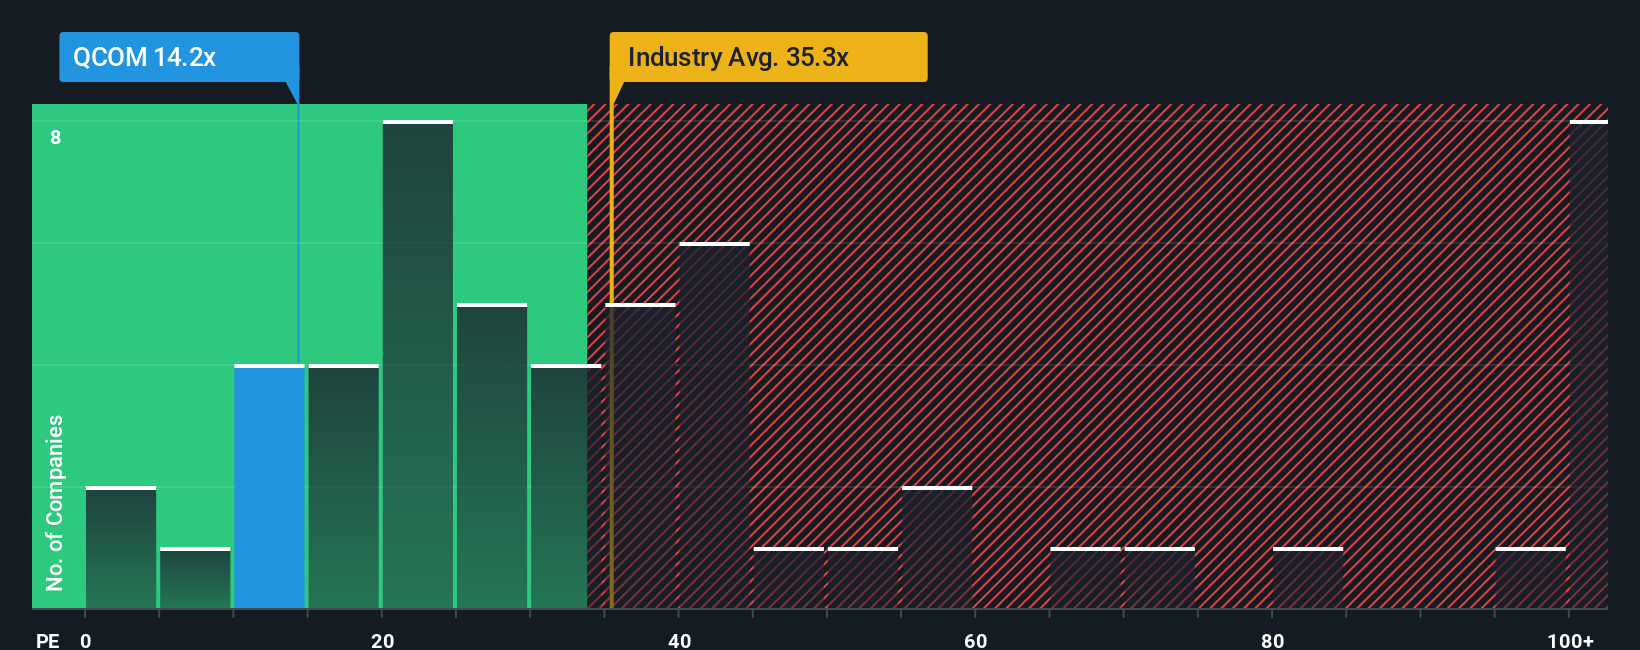
QUALCOMM currently trades on a P/E of 31.57x, compared with the broader Semiconductor industry average of 42.57x and a peer group average of 87.47x. Simply Wall St’s “Fair Ratio” for QUALCOMM is 32.56x, which is its proprietary estimate of what the P/E should be given factors such as earnings growth, margins, industry, market cap and risk profile.
This Fair Ratio aims to be more tailored than a simple peer or industry comparison because it adjusts for company specific characteristics rather than assuming all chip stocks deserve the same multiple. QUALCOMM’s actual P/E of 31.57x is very close to the Fair Ratio of 32.56x, suggesting the current earnings based valuation is broadly in line with these fundamentals.
Result: ABOUT RIGHT
P/E ratios tell one story, but what if the real opportunity lies elsewhere? Discover 1440 companies where insiders are betting big on explosive growth.
Upgrade Your Decision Making: Choose your QUALCOMM Narrative
Earlier we mentioned that there is an even better way to understand valuation, so let us introduce you to Narratives, a simple way to connect your view of QUALCOMM’s story with your own revenue, earnings and margin assumptions. You can then turn that into a Fair Value and compare it with today’s price using an easy tool on Simply Wall St’s Community page that updates as new information like FY2025 results, Edge AI developments or analyst targets come in. One investor might build a Narrative that sees QUALCOMM’s Fair Value closer to US$300 based on strong Edge AI, automotive and IoT momentum. Another might set a Fair Value nearer to US$193 by focusing on analyst assumptions, risks around competition and regulation, and a more moderate future P/E of about 20.6x. This gives you a clear, story driven framework to decide whether the current price feels attractive, expensive, or about right for your own view.
Do you think there's more to the story for QUALCOMM? Head over to our Community to see what others are saying!

This article by Simply Wall St is general in nature. We provide commentary based on historical data and analyst forecasts only using an unbiased methodology and our articles are not intended to be financial advice. It does not constitute a recommendation to buy or sell any stock, and does not take account of your objectives, or your financial situation. We aim to bring you long-term focused analysis driven by fundamental data. Note that our analysis may not factor in the latest price-sensitive company announcements or qualitative material. Simply Wall St has no position in any stocks mentioned.
Valuation is complex, but we're here to simplify it.
Discover if QUALCOMM might be undervalued or overvalued with our detailed analysis, featuring fair value estimates, potential risks, dividends, insider trades, and its financial condition.
Access Free AnalysisHave feedback on this article? Concerned about the content? Get in touch with us directly. Alternatively, email editorial-team@simplywallst.com
About NasdaqGS:QCOM
QUALCOMM
Engages in the development and commercialization of foundational technologies for the wireless industry worldwide.
Flawless balance sheet established dividend payer.
Similar Companies
Market Insights


Advertisement
Weekly Picks
LO


Lou_Basenese on Cue Biopharma ·
Cue Biopharma (NASDAQ: CUE): The Scientist Behind Xolair Just Gave Cue a Next-Generation Shot at the Same Multi-Billion-Dollar Market
Fair Value:US$7060.2% undervalued
26 followersusers have followed this narrative
0 commentsusers have commented on this narrative
5 likesusers have liked this narrative
HA


HarishPK on Adobe ·
Adobe: A Probabilistic Case for Undervaluation
Fair Value:US$317.226.4% undervalued
32 followersusers have followed this narrative
7 commentsusers have commented on this narrative
10 likesusers have liked this narrative
NI


niteco on Broadcom ·
A Capital Allocation Favorite with Structural Importance
Fair Value:US$651.0542.8% undervalued
36 followersusers have followed this narrative
0 commentsusers have commented on this narrative
6 likesusers have liked this narrative
TO


Tokyo on Okta ·
Good foundation, but now it's all about the next steps
Fair Value:US$15123.9% undervalued
85 followersusers have followed this narrative
7 commentsusers have commented on this narrative
11 likesusers have liked this narrative
Recently Updated Narratives
AN

AntonioS on CSL ·
CSL Investment Thesis
Fair Value:AU$14026.5% undervalued
1 followerusers have followed this narrative
0 commentsusers have commented on this narrative
0 likesusers have liked this narrative
MA


martinarauz on Nu Holdings ·
Investment Analysis (May 2026)
Fair Value:US$22.7448.9% undervalued
58 followersusers have followed this narrative
0 commentsusers have commented on this narrative
0 likesusers have liked this narrative
VA


Valtersa on Mouwasat Medical Services ·
Mouwasat Medical Services Will Achieve a 25% Profit Margin in Just 3 Years
Fair Value:ر.س98.634.3% undervalued
1 followerusers have followed this narrative
0 commentsusers have commented on this narrative
0 likesusers have liked this narrative
Popular Narratives
MA
martinarauz on Nu Holdings ·
Investment Analysis (May 2026)
Fair Value:US$22.7448.9% undervalued
58 followersusers have followed this narrative
0 commentsusers have commented on this narrative
15 likesusers have liked this narrative
CL


Clive_Thompson on Take-Two Interactive Software ·
Take-Two Interactive: The Calm Before the Storm NASDAQ: TTWO Last Price: $242.41 Date: May 15, 2026
Fair Value:US$276.9724.0% undervalued
58 followersusers have followed this narrative
0 commentsusers have commented on this narrative
14 likesusers have liked this narrative
NI

niteco on Honeywell International ·
Honeywell - The Demand-Side of the AI Infrastructure
Fair Value:US$320.1935.7% undervalued
48 followersusers have followed this narrative
0 commentsusers have commented on this narrative
19 likesusers have liked this narrative
Trending Discussion

SI

Simply Wall St User on Access Holdings ·
It's wonderful. It has greatly helped me take informed decisions.
1
|0
