
Advertisement
- United States
- /
- Semiconductors
- /
- NasdaqGS:GFS
GlobalFoundries Full Year 2024 Earnings: EPS Misses Expectations

GlobalFoundries (NASDAQ:GFS) Full Year 2024 Results
Key Financial Results
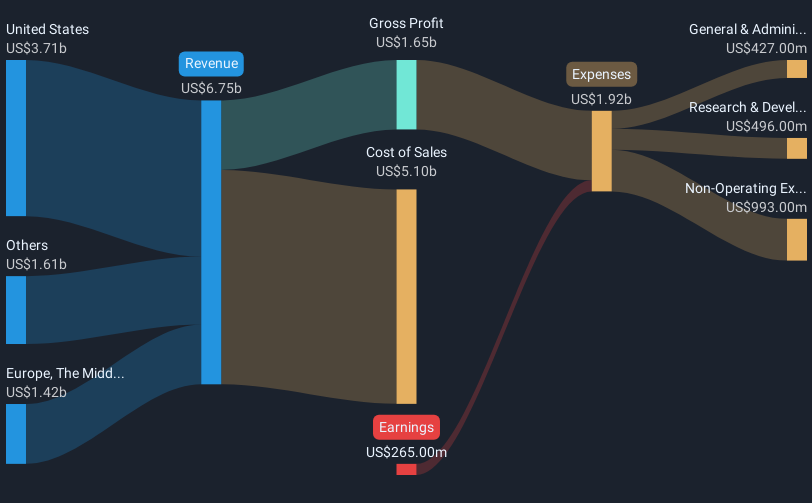
- Revenue: US$6.75b (down 8.7% from FY 2023).
- Net loss: US$265.0m (down by 126% from US$1.02b profit in FY 2023).
- US$0.48 loss per share (down from US$1.85 profit in FY 2023).
All figures shown in the chart above are for the trailing 12 month (TTM) period
GlobalFoundries EPS Misses Expectations
Revenue was in line with analyst estimates. Earnings per share (EPS) missed analyst estimates.
The primary driver behind last 12 months revenue was the United States segment contributing a total revenue of US$3.71b (55% of total revenue). Notably, cost of sales worth US$5.10b amounted to 76% of total revenue thereby underscoring the impact on earnings. The most substantial expense, totaling US$993.0m were related to Non-Operating costs. This indicates that a significant portion of the company's costs is related to non-core activities. Explore how GFS's revenue and expenses shape its earnings.
Looking ahead, revenue is forecast to grow 8.1% p.a. on average during the next 3 years, compared to a 16% growth forecast for the Semiconductor industry in the US.
Performance of the American Semiconductor industry.
The company's shares are up 2.4% from a week ago.
Balance Sheet Analysis
Just as investors must consider earnings, it is also important to take into account the strength of a company's balance sheet. We have a graphic representation of GlobalFoundries' balance sheet and an in-depth analysis of the company's financial position.
New: Manage All Your Stock Portfolios in One Place
We've created the ultimate portfolio companion for stock investors, and it's free.
• Connect an unlimited number of Portfolios and see your total in one currency
• Be alerted to new Warning Signs or Risks via email or mobile
• Track the Fair Value of your stocks
Have feedback on this article? Concerned about the content? Get in touch with us directly. Alternatively, email editorial-team (at) simplywallst.com.
This article by Simply Wall St is general in nature. We provide commentary based on historical data and analyst forecasts only using an unbiased methodology and our articles are not intended to be financial advice. It does not constitute a recommendation to buy or sell any stock, and does not take account of your objectives, or your financial situation. We aim to bring you long-term focused analysis driven by fundamental data. Note that our analysis may not factor in the latest price-sensitive company announcements or qualitative material. Simply Wall St has no position in any stocks mentioned.
About NasdaqGS:GFS
GlobalFoundries
A semiconductor foundry, provides range of mainstream wafer fabrication services and technologies worldwide.
Flawless balance sheet with moderate growth potential.
Similar Companies
Market Insights

Advertisement
Community Narratives
MicroStrategy: Volatile Gamble or Golden Opportunity?
Fair Value US$663.00|35.7% undervalued
BL
Community Contributor
Emerging Markets and Debt Reduction Will Propel Bath & Body Works Forward
Fair Value US$40.73|20.5% undervalued
ZW
Community Contributor
An amazing opportunity to potentially get a 100 bagger
Fair Value US$10.00|25.2% overvalued
DA
Community Contributor