
Advertisement
- United States
- /
- Semiconductors
- /
- NasdaqGM:ENPH
Is Enphase Energy, Inc. (NASDAQ:ENPH) Trading At A 50% Discount?

Key Insights
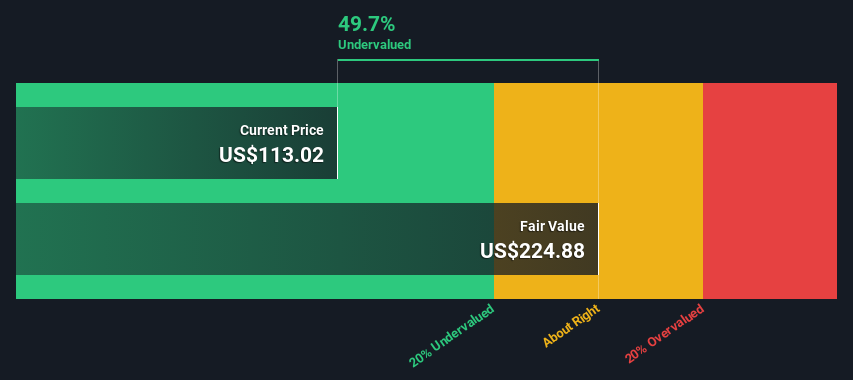
- Enphase Energy's estimated fair value is US$225 based on 2 Stage Free Cash Flow to Equity
- Enphase Energy's US$113 share price signals that it might be 50% undervalued
- Analyst price target for ENPH is US$127 which is 43% below our fair value estimate
Does the October share price for Enphase Energy, Inc. (NASDAQ:ENPH) reflect what it's really worth? Today, we will estimate the stock's intrinsic value by taking the expected future cash flows and discounting them to today's value. Our analysis will employ the Discounted Cash Flow (DCF) model. Before you think you won't be able to understand it, just read on! It's actually much less complex than you'd imagine.
Remember though, that there are many ways to estimate a company's value, and a DCF is just one method. For those who are keen learners of equity analysis, the Simply Wall St analysis model here may be something of interest to you.
View our latest analysis for Enphase Energy
The Model
We're using the 2-stage growth model, which simply means we take in account two stages of company's growth. In the initial period the company may have a higher growth rate and the second stage is usually assumed to have a stable growth rate. To start off with, we need to estimate the next ten years of cash flows. Where possible we use analyst estimates, but when these aren't available we extrapolate the previous free cash flow (FCF) from the last estimate or reported value. We assume companies with shrinking free cash flow will slow their rate of shrinkage, and that companies with growing free cash flow will see their growth rate slow, over this period. We do this to reflect that growth tends to slow more in the early years than it does in later years.
Generally we assume that a dollar today is more valuable than a dollar in the future, so we need to discount the sum of these future cash flows to arrive at a present value estimate:
10-year free cash flow (FCF) forecast
| 2025 | 2026 | 2027 | 2028 | 2029 | 2030 | 2031 | 2032 | 2033 | 2034 | |
| Levered FCF ($, Millions) | US$598.2m | US$723.9m | US$992.0m | US$1.34b | US$1.61b | US$1.84b | US$2.04b | US$2.22b | US$2.36b | US$2.49b |
| Growth Rate Estimate Source | Analyst x16 | Analyst x11 | Analyst x5 | Analyst x2 | Est @ 19.85% | Est @ 14.64% | Est @ 11.00% | Est @ 8.45% | Est @ 6.67% | Est @ 5.42% |
| Present Value ($, Millions) Discounted @ 8.2% | US$553 | US$619 | US$784 | US$979 | US$1.1k | US$1.2k | US$1.2k | US$1.2k | US$1.2k | US$1.1k |
("Est" = FCF growth rate estimated by Simply Wall St)
Present Value of 10-year Cash Flow (PVCF) = US$9.8b
The second stage is also known as Terminal Value, this is the business's cash flow after the first stage. The Gordon Growth formula is used to calculate Terminal Value at a future annual growth rate equal to the 5-year average of the 10-year government bond yield of 2.5%. We discount the terminal cash flows to today's value at a cost of equity of 8.2%.
Terminal Value (TV)= FCF2034 × (1 + g) ÷ (r – g) = US$2.5b× (1 + 2.5%) ÷ (8.2%– 2.5%) = US$45b
Present Value of Terminal Value (PVTV)= TV / (1 + r)10= US$45b÷ ( 1 + 8.2%)10= US$21b
The total value, or equity value, is then the sum of the present value of the future cash flows, which in this case is US$30b. To get the intrinsic value per share, we divide this by the total number of shares outstanding. Relative to the current share price of US$113, the company appears quite undervalued at a 50% discount to where the stock price trades currently. Valuations are imprecise instruments though, rather like a telescope - move a few degrees and end up in a different galaxy. Do keep this in mind.
The Assumptions
Now the most important inputs to a discounted cash flow are the discount rate, and of course, the actual cash flows. Part of investing is coming up with your own evaluation of a company's future performance, so try the calculation yourself and check your own assumptions. The DCF also does not consider the possible cyclicality of an industry, or a company's future capital requirements, so it does not give a full picture of a company's potential performance. Given that we are looking at Enphase Energy as potential shareholders, the cost of equity is used as the discount rate, rather than the cost of capital (or weighted average cost of capital, WACC) which accounts for debt. In this calculation we've used 8.2%, which is based on a levered beta of 1.373. Beta is a measure of a stock's volatility, compared to the market as a whole. We get our beta from the industry average beta of globally comparable companies, with an imposed limit between 0.8 and 2.0, which is a reasonable range for a stable business.
SWOT Analysis for Enphase Energy
Strength
- Debt is not viewed as a risk.
Weakness
- Earnings declined over the past year.
Opportunity
- Annual earnings are forecast to grow faster than the American market.
- Trading below our estimate of fair value by more than 20%.
Threat
- Revenue is forecast to grow slower than 20% per year.
Next Steps:
Valuation is only one side of the coin in terms of building your investment thesis, and it shouldn't be the only metric you look at when researching a company. The DCF model is not a perfect stock valuation tool. Preferably you'd apply different cases and assumptions and see how they would impact the company's valuation. For example, changes in the company's cost of equity or the risk free rate can significantly impact the valuation. What is the reason for the share price sitting below the intrinsic value? For Enphase Energy, there are three additional elements you should further research:
- Risks: You should be aware of the 1 warning sign for Enphase Energy we've uncovered before considering an investment in the company.
- Future Earnings: How does ENPH's growth rate compare to its peers and the wider market? Dig deeper into the analyst consensus number for the upcoming years by interacting with our free analyst growth expectation chart.
- Other Solid Businesses: Low debt, high returns on equity and good past performance are fundamental to a strong business. Why not explore our interactive list of stocks with solid business fundamentals to see if there are other companies you may not have considered!
PS. The Simply Wall St app conducts a discounted cash flow valuation for every stock on the NASDAQGM every day. If you want to find the calculation for other stocks just search here.
Valuation is complex, but we're here to simplify it.
Discover if Enphase Energy might be undervalued or overvalued with our detailed analysis, featuring fair value estimates, potential risks, dividends, insider trades, and its financial condition.
Access Free AnalysisHave feedback on this article? Concerned about the content? Get in touch with us directly. Alternatively, email editorial-team (at) simplywallst.com.
This article by Simply Wall St is general in nature. We provide commentary based on historical data and analyst forecasts only using an unbiased methodology and our articles are not intended to be financial advice. It does not constitute a recommendation to buy or sell any stock, and does not take account of your objectives, or your financial situation. We aim to bring you long-term focused analysis driven by fundamental data. Note that our analysis may not factor in the latest price-sensitive company announcements or qualitative material. Simply Wall St has no position in any stocks mentioned.
About NasdaqGM:ENPH
Enphase Energy
Designs, develops, manufactures, and sells home energy solutions for the solar photovoltaic industry in the United States and internationally.
Excellent balance sheet with reasonable growth potential.
Similar Companies
Market Insights

Advertisement
Community Narratives
MicroStrategy: Volatile Gamble or Golden Opportunity?
Fair Value US$663.00|35.7% undervalued
BL
Community Contributor
Emerging Markets and Debt Reduction Will Propel Bath & Body Works Forward
Fair Value US$40.73|20.5% undervalued
ZW
Community Contributor
An amazing opportunity to potentially get a 100 bagger
Fair Value US$10.00|25.2% overvalued
DA
Community Contributor