

Howard Marks put it nicely when he said that, rather than worrying about share price volatility, 'The possibility of permanent loss is the risk I worry about... and every practical investor I know worries about.' It's only natural to consider a company's balance sheet when you examine how risky it is, since debt is often involved when a business collapses. As with many other companies Cohu, Inc. (NASDAQ:COHU) makes use of debt. But the real question is whether this debt is making the company risky.
When Is Debt A Problem?
Debt assists a business until the business has trouble paying it off, either with new capital or with free cash flow. In the worst case scenario, a company can go bankrupt if it cannot pay its creditors. However, a more usual (but still expensive) situation is where a company must dilute shareholders at a cheap share price simply to get debt under control. By replacing dilution, though, debt can be an extremely good tool for businesses that need capital to invest in growth at high rates of return. When we think about a company's use of debt, we first look at cash and debt together.
Check out our latest analysis for Cohu
How Much Debt Does Cohu Carry?
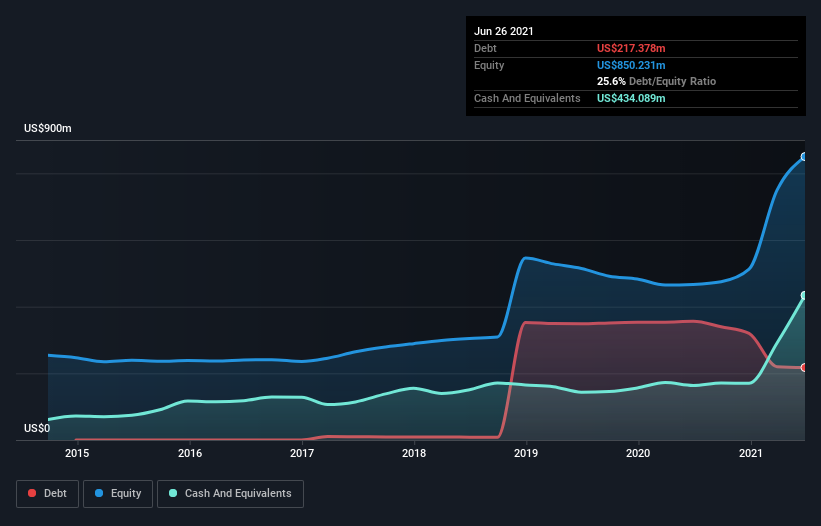
The image below, which you can click on for greater detail, shows that Cohu had debt of US$217.4m at the end of June 2021, a reduction from US$356.0m over a year. But on the other hand it also has US$434.1m in cash, leading to a US$216.7m net cash position.
How Healthy Is Cohu's Balance Sheet?
According to the last reported balance sheet, Cohu had liabilities of US$321.3m due within 12 months, and liabilities of US$200.2m due beyond 12 months. Offsetting this, it had US$434.1m in cash and US$216.0m in receivables that were due within 12 months. So it can boast US$128.6m more liquid assets than total liabilities.
This short term liquidity is a sign that Cohu could probably pay off its debt with ease, as its balance sheet is far from stretched. Simply put, the fact that Cohu has more cash than debt is arguably a good indication that it can manage its debt safely.
It was also good to see that despite losing money on the EBIT line last year, Cohu turned things around in the last 12 months, delivering and EBIT of US$108m. When analysing debt levels, the balance sheet is the obvious place to start. But it is future earnings, more than anything, that will determine Cohu's ability to maintain a healthy balance sheet going forward. So if you want to see what the professionals think, you might find this free report on analyst profit forecasts to be interesting.
But our final consideration is also important, because a company cannot pay debt with paper profits; it needs cold hard cash. While Cohu has net cash on its balance sheet, it's still worth taking a look at its ability to convert earnings before interest and tax (EBIT) to free cash flow, to help us understand how quickly it is building (or eroding) that cash balance. Over the most recent year, Cohu recorded free cash flow worth 52% of its EBIT, which is around normal, given free cash flow excludes interest and tax. This cold hard cash means it can reduce its debt when it wants to.
Summing up
While we empathize with investors who find debt concerning, you should keep in mind that Cohu has net cash of US$216.7m, as well as more liquid assets than liabilities. So we are not troubled with Cohu's debt use. When analysing debt levels, the balance sheet is the obvious place to start. But ultimately, every company can contain risks that exist outside of the balance sheet. For example, we've discovered 4 warning signs for Cohu (1 shouldn't be ignored!) that you should be aware of before investing here.
Of course, if you're the type of investor who prefers buying stocks without the burden of debt, then don't hesitate to discover our exclusive list of net cash growth stocks, today.
If you decide to trade Cohu, use the lowest-cost* platform that is rated #1 Overall by Barron’s, Interactive Brokers. Trade stocks, options, futures, forex, bonds and funds on 135 markets, all from a single integrated account. Promoted
New: AI Stock Screener & Alerts
Our new AI Stock Screener scans the market every day to uncover opportunities.
• Dividend Powerhouses (3%+ Yield)
• Undervalued Small Caps with Insider Buying
• High growth Tech and AI Companies
Or build your own from over 50 metrics.
This article by Simply Wall St is general in nature. We provide commentary based on historical data and analyst forecasts only using an unbiased methodology and our articles are not intended to be financial advice. It does not constitute a recommendation to buy or sell any stock, and does not take account of your objectives, or your financial situation. We aim to bring you long-term focused analysis driven by fundamental data. Note that our analysis may not factor in the latest price-sensitive company announcements or qualitative material. Simply Wall St has no position in any stocks mentioned.
*Interactive Brokers Rated Lowest Cost Broker by StockBrokers.com Annual Online Review 2020
Have feedback on this article? Concerned about the content? Get in touch with us directly. Alternatively, email editorial-team (at) simplywallst.com.
About NasdaqGS:COHU
Cohu
Through its subsidiaries, provides semiconductor test equipment and services in the United States, China, Malaysia, the Philippines, Singapore, and internationally.
Excellent balance sheet and fair value.
Similar Companies
Market Insights

Community Narratives

