
Advertisement
- United States
- /
- Semiconductors
- /
- NasdaqGS:AXTI
AXT (NASDAQ:AXTI) adds US$6.2m to market cap in the past 7 days, though investors from five years ago are still down 74%

AXT, Inc. (NASDAQ:AXTI) shareholders should be happy to see the share price up 24% in the last month. But that doesn't change the fact that the returns over the last half decade have been stomach churning. Five years have seen the share price descend precipitously, down a full 74%. So we don't gain too much confidence from the recent recovery. The important question is if the business itself justifies a higher share price in the long term.
While the last five years has been tough for AXT shareholders, this past week has shown signs of promise. So let's look at the longer term fundamentals and see if they've been the driver of the negative returns.
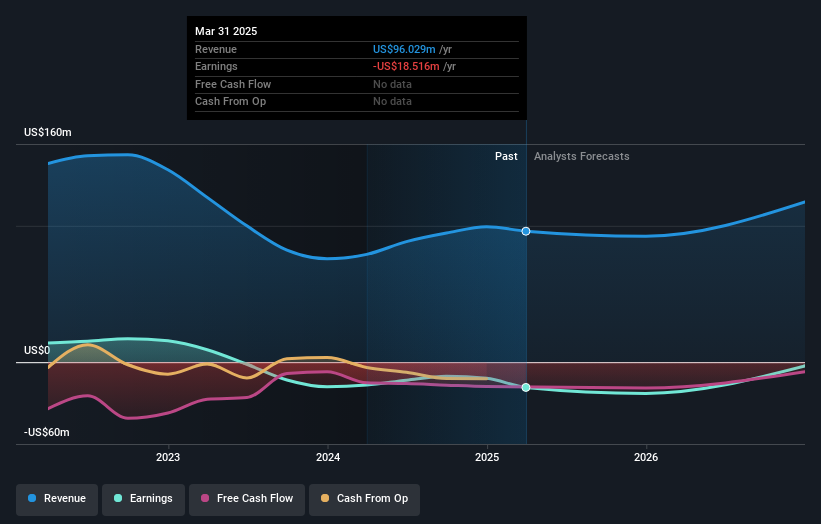
We've discovered 2 warning signs about AXT. View them for free.AXT wasn't profitable in the last twelve months, it is unlikely we'll see a strong correlation between its share price and its earnings per share (EPS). Arguably revenue is our next best option. When a company doesn't make profits, we'd generally hope to see good revenue growth. As you can imagine, fast revenue growth, when maintained, often leads to fast profit growth.
Over half a decade AXT reduced its trailing twelve month revenue by 2.0% for each year. While far from catastrophic that is not good. If a business loses money, you want it to grow, so no surprises that the share price has dropped 12% each year in that time. It takes a certain kind of mental fortitude (or recklessness) to buy shares in a company that loses money and doesn't grow revenue. That is not really what the successful investors we know aim for.
The graphic below depicts how earnings and revenue have changed over time (unveil the exact values by clicking on the image).
Take a more thorough look at AXT's financial health with this free report on its balance sheet.
A Different Perspective
AXT shareholders are down 58% for the year, but the market itself is up 13%. However, keep in mind that even the best stocks will sometimes underperform the market over a twelve month period. Unfortunately, last year's performance may indicate unresolved challenges, given that it was worse than the annualised loss of 12% over the last half decade. We realise that Baron Rothschild has said investors should "buy when there is blood on the streets", but we caution that investors should first be sure they are buying a high quality business. I find it very interesting to look at share price over the long term as a proxy for business performance. But to truly gain insight, we need to consider other information, too. To that end, you should learn about the 2 warning signs we've spotted with AXT (including 1 which is significant) .
Of course AXT may not be the best stock to buy. So you may wish to see this free collection of growth stocks.
Please note, the market returns quoted in this article reflect the market weighted average returns of stocks that currently trade on American exchanges.
New: Manage All Your Stock Portfolios in One Place
We've created the ultimate portfolio companion for stock investors, and it's free.
• Connect an unlimited number of Portfolios and see your total in one currency
• Be alerted to new Warning Signs or Risks via email or mobile
• Track the Fair Value of your stocks
Have feedback on this article? Concerned about the content? Get in touch with us directly. Alternatively, email editorial-team (at) simplywallst.com.
This article by Simply Wall St is general in nature. We provide commentary based on historical data and analyst forecasts only using an unbiased methodology and our articles are not intended to be financial advice. It does not constitute a recommendation to buy or sell any stock, and does not take account of your objectives, or your financial situation. We aim to bring you long-term focused analysis driven by fundamental data. Note that our analysis may not factor in the latest price-sensitive company announcements or qualitative material. Simply Wall St has no position in any stocks mentioned.
About NasdaqGS:AXTI
AXT
Designs, develops, manufactures, and distributes compound and single element semiconductor substrates.
Mediocre balance sheet very low.
Similar Companies
Market Insights


Advertisement
Community Narratives
Suncorp’s Next Chapter: Insurance-Only and Ready to Grow
Fair Value AU$22.83|4.9% undervalued
RO
Community Contributor
Thyssenkrupp Nucera Will Achieve Double-Digit Profits by 2030 Boosted by Hydrogen Growth
Fair Value €14.40|32.5% undervalued
CH
Community Contributor
Tesla’s Nvidia Moment – The AI & Robotics Inflection Point
Fair Value US$384.84|21.9% undervalued
BL
Community Contributor