- United States
- /
- Semiconductors
- /
- NasdaqGS:AMD
Does the OpenAI Partnership Shift AMD’s Price Outlook for 2025?

Reviewed by Bailey Pemberton
If you have been watching the tech sector or considering a position in Advanced Micro Devices, there has been plenty to discuss lately. AMD's stock has rallied about 9.0% over the last month and a strong 36.5% year-to-date. That comes on the heels of an August-September dip, which now looks more like a pause than a trend reversal. Still, over the past year, shares are off by 3.7%, a reminder that volatility is par for the course for chipmakers navigating both AI hype cycles and competitive threats.
The latest news cycle has been electric. AMD’s headline-grabbing deal with OpenAI, a multibillion-dollar chip partnership, helped highlight the company's potential in the AI arms race and might explain some of the recent bounce. There have also been persistent stories swirling about new partnerships and foundry deals. While some rumors, like AMD supposedly fabbing chips at Intel, have been debunked, the sheer amount of news flow is raising the company’s profile and, perhaps, investor expectations. With longer-term returns sparkling, up 184.8% over three years and 95.4% over five, you can see why it remains a growth darling.
However, for all the excitement, AMD’s valuation story is more complicated. If we run AMD through a battery of six standard valuation checks, the company doesn’t come out as undervalued on a single one. That gives AMD a valuation score of 0 out of 6, a sign that optimism is already well priced in or even a little ahead of itself.
Next, let’s break down how these valuation checks play out. Later, we’ll get into an even more insightful way to look at what AMD is really worth.
Advanced Micro Devices scores just 0/6 on our valuation checks. See what other red flags we found in the full valuation breakdown.
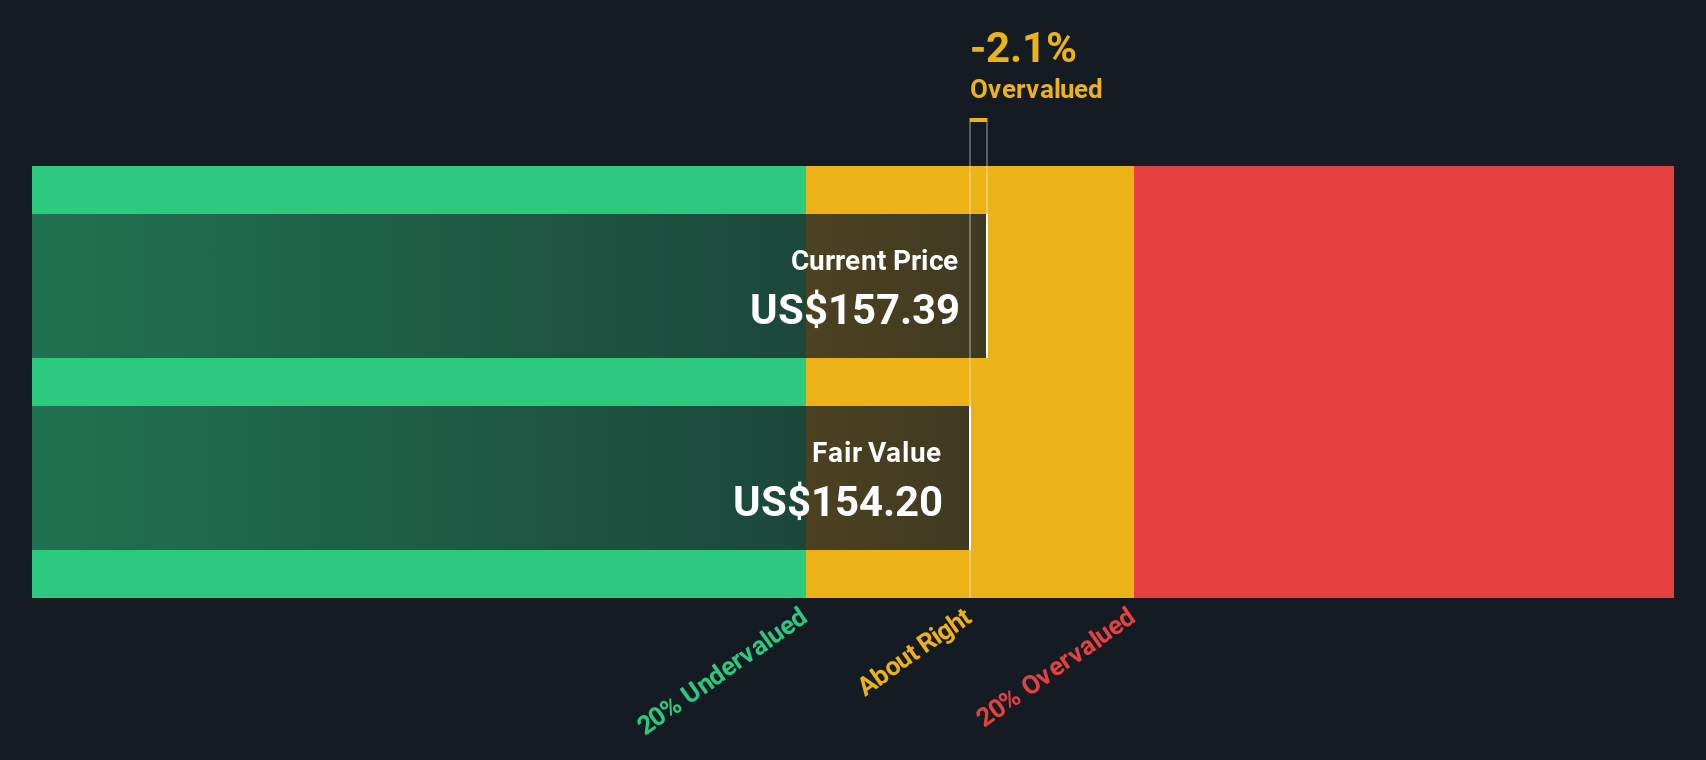
Approach 1: Advanced Micro Devices Discounted Cash Flow (DCF) Analysis
A Discounted Cash Flow (DCF) analysis estimates a company's intrinsic value by forecasting its future free cash flows and discounting them back to today's value. This approach is widely used because it attempts to capture the true, underlying worth of a business based on its ability to generate cash over time.
For Advanced Micro Devices, the current free cash flow stands at approximately $4.1 billion. Analyst estimates project robust growth, with free cash flow expected to climb to more than $16.2 billion by 2029. While analysts provide direct forecasts up to around five years out, longer-term projections such as those beyond 2029 are extrapolated based on trends and should be taken as directional rather than certain.
According to this DCF model, the stock's estimated intrinsic value is $151.33 per share. This figure is roughly 8.8% below the actual trading price, meaning AMD is currently priced at a modest premium to its calculated fair value.
Result: ABOUT RIGHT
Simply Wall St performs a valuation analysis on every stock in the world every day (check out Advanced Micro Devices's valuation analysis). We show the entire calculation in full. You can track the result in your watchlist or portfolio and be alerted when this changes.
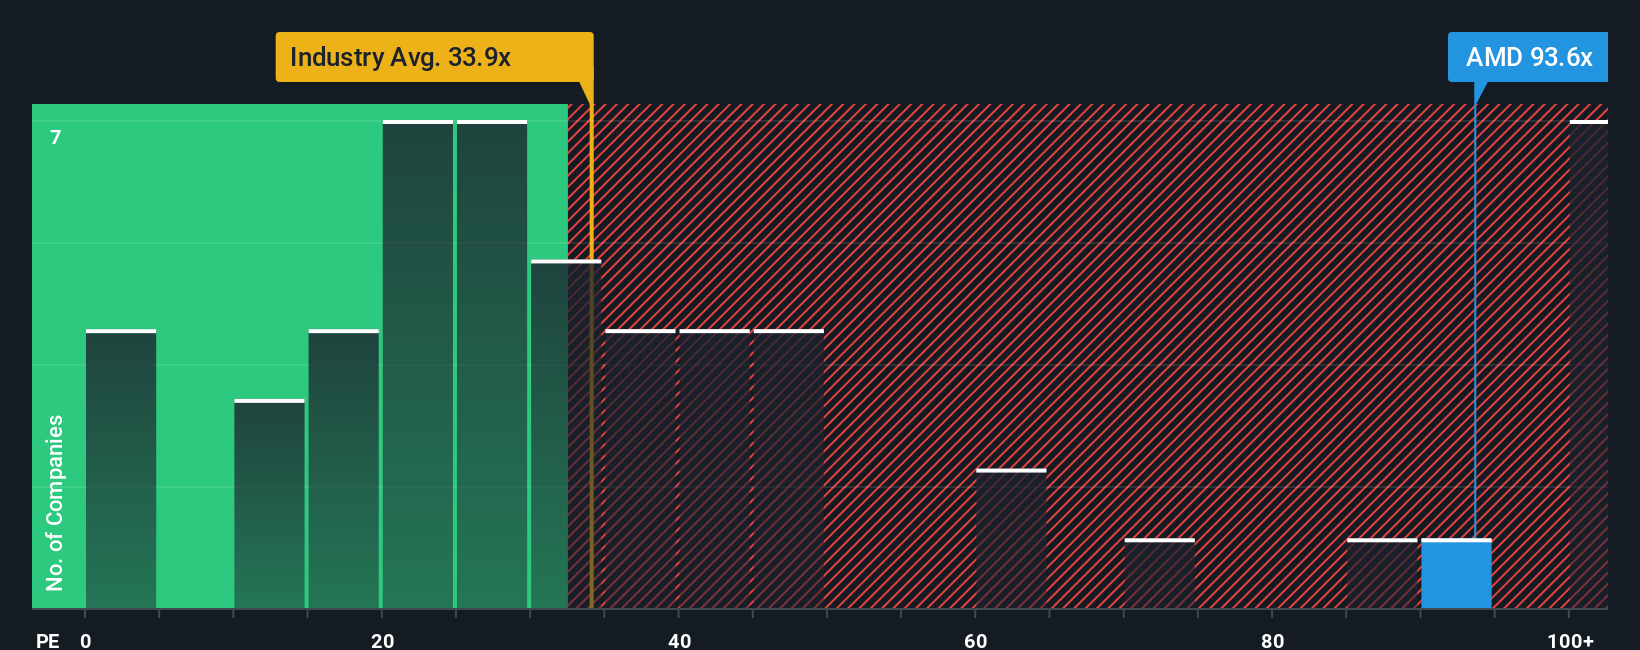
Approach 2: Advanced Micro Devices Price vs Earnings
For profitable technology companies like Advanced Micro Devices, the Price-to-Earnings (PE) ratio is often the go-to metric for investors. It provides a straightforward way to gauge how much investors are paying today for each dollar of current earnings, making it especially useful for companies with established and growing profits.
Growth expectations and risk play an essential role in what PE ratio is considered “normal.” If a company is seen as a high-growth opportunity, investors may accept a higher PE ratio, anticipating bigger earnings down the line. Conversely, high risk or slower growth typically means a lower PE is warranted. Comparing AMD’s current PE of 97.9x to the peer average of 33.5x and the semiconductor industry average of 37.0x makes its premium valuation clear.
Simply Wall St’s “Fair Ratio” refines this analysis by calculating what PE multiple is warranted, based on factors specific to AMD such as its expected earnings growth, profit margins, industry attributes, overall risk, and market cap. Since the Fair Ratio builds in these company-specific and market-wide dynamics, it offers a more tailored benchmark than an industry or peer comparison alone. For AMD, the Fair Ratio currently stands at 51.8x, which is significantly lower than its actual PE.
With AMD trading at nearly double its Fair Ratio, the stock looks richly valued by this lens.
Result: OVERVALUED
PE ratios tell one story, but what if the real opportunity lies elsewhere? Discover companies where insiders are betting big on explosive growth.
Upgrade Your Decision Making: Choose your Advanced Micro Devices Narrative
Earlier we mentioned there is an even better way to understand valuation, so let’s introduce you to Narratives. A Narrative is a simple yet powerful tool that lets you describe the story you believe about a company, linking your assumptions about its future revenue, earnings, and margins directly to your estimate of fair value.
Instead of just looking at static ratios or stock prices, Narratives connect the dots. They start with your view of AMD’s potential (“the story”), translate that into a transparent financial forecast, and calculate a fair value so you can clearly see when the stock is cheap, expensive, or fairly priced. Narratives are easy to use and accessible to all investors on the Simply Wall St Community page, where millions share and update their perspectives as news and results come in, keeping analyses fresh and responsive to change.
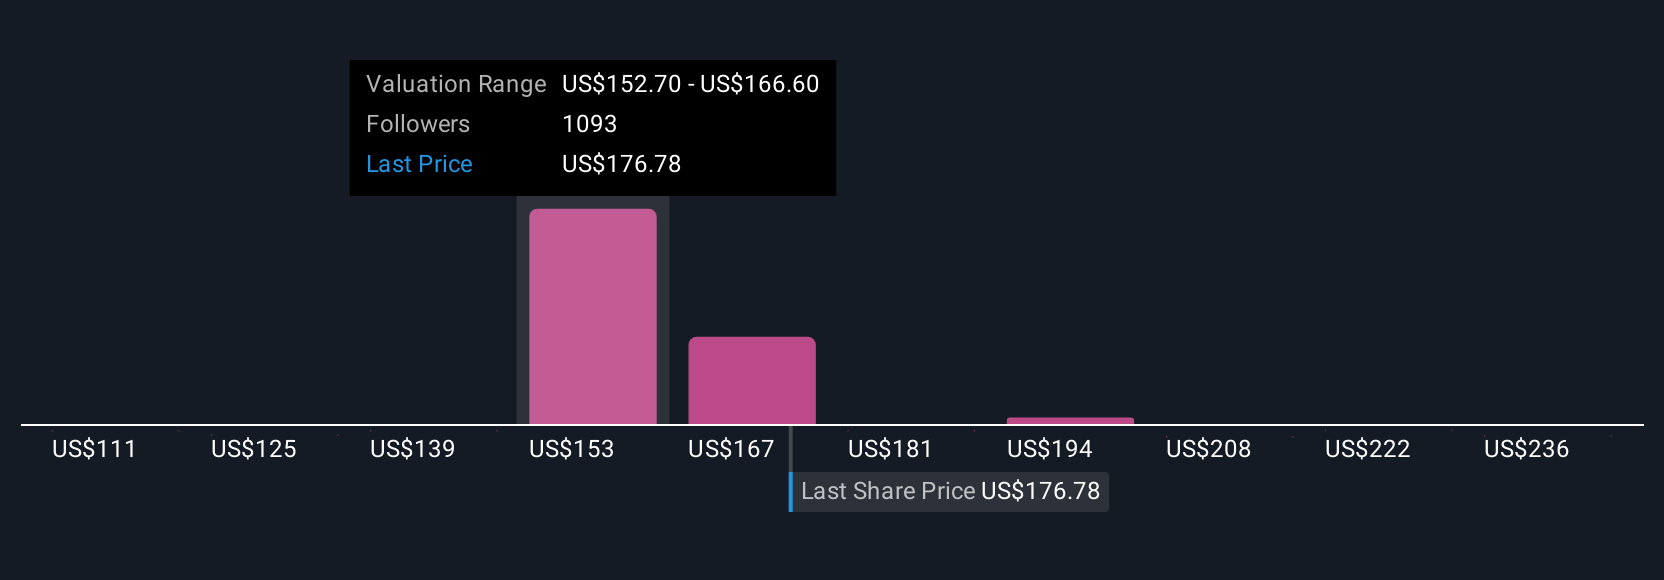
This approach empowers you to decide confidently when to buy, sell, or hold by comparing your Narrative’s fair value against AMD’s current price. For example, some investors recently estimated AMD’s fair value as high as $230, believing in rapid AI expansion and margin growth, while others saw it near $103, expecting headwinds from competition and regulatory risks. This demonstrates how different stories lead to different valuations. Narratives help you invest smarter by letting the numbers tell your version of AMD’s journey.
For Advanced Micro Devices, it is straightforward to explore key narratives with previews of two leading Advanced Micro Devices perspectives:
🐂 Advanced Micro Devices Bull CaseFair Value: $180.10
Current Price vs. Fair Value: -8.6%
Revenue Growth Rate: 16.5%
- Believes AMD’s focus on hardware efficiency, pricing strategies, and the Xilinx acquisition positions the company to overtake Intel in desktop CPUs and establish a strong niche in GPUs and data centers.
- Sees significant opportunities in adaptive computing and AI, with partnerships and product launches creating the foundation for double-digit revenue growth across segments.
- Thinks AMD can effectively compete by undercutting rivals on price, supporting open software, and expanding its reach with innovative, energy-efficient hardware.
Fair Value: $103.16
Current Price vs. Fair Value: +59.6%
Revenue Growth Rate: 16.0%
- Anticipates AMD’s profitability will be pressured as strong competition from Nvidia and Intel leads to sustained high R&D spending and narrower margins.
- Projects strong short-term revenue growth from AI and CPUs, but expects this to slow as chip demand cycles mature and the current AI investment surge stabilizes.
- Warns that AMD could be overvalued if future growth and margins moderate, resulting in a substantially lower long-term fair value compared to today’s share price.
Do you think there's more to the story for Advanced Micro Devices? Create your own Narrative to let the Community know!
This article by Simply Wall St is general in nature. We provide commentary based on historical data and analyst forecasts only using an unbiased methodology and our articles are not intended to be financial advice. It does not constitute a recommendation to buy or sell any stock, and does not take account of your objectives, or your financial situation. We aim to bring you long-term focused analysis driven by fundamental data. Note that our analysis may not factor in the latest price-sensitive company announcements or qualitative material. Simply Wall St has no position in any stocks mentioned.
The New Payments ETF Is Live on NASDAQ:
Money is moving to real-time rails, and a newly listed ETF now gives investors direct exposure. Fast settlement. Institutional custody. Simple access.
Explore how this launch could reshape portfolios
Sponsored ContentNew: Manage All Your Stock Portfolios in One Place
We've created the ultimate portfolio companion for stock investors, and it's free.
• Connect an unlimited number of Portfolios and see your total in one currency
• Be alerted to new Warning Signs or Risks via email or mobile
• Track the Fair Value of your stocks
Have feedback on this article? Concerned about the content? Get in touch with us directly. Alternatively, email editorial-team@simplywallst.com
About NasdaqGS:AMD
Exceptional growth potential with flawless balance sheet.
Similar Companies
Market Insights


Weekly Picks

Early mover in a fast growing industry. Likely to experience share price volatility as they scale


A case for CA$31.80 (undiluted), aka 8,616% upside from CA$0.37 (an 86 bagger!).


Moderation and Stabilisation: HOLD: Fair Price based on a 4-year Cycle is $12.08
Recently Updated Narratives

Airbnb Stock: Platform Growth in a World of Saturation and Scrutiny

Adobe Stock: AI-Fueled ARR Growth Pushes Guidance Higher, But Cost Pressures Loom

Thomson Reuters Stock: When Legal Intelligence Becomes Mission-Critical Infrastructure
Popular Narratives


Crazy Undervalued 42 Baggers Silver Play (Active & Running Mine)


NVDA: Expanding AI Demand Will Drive Major Data Center Investments Through 2026

The AI Infrastructure Giant Grows Into Its Valuation
Trending Discussion


