- United States
- /
- Semiconductors
- /
- NasdaqGS:AMAT
Here is why it is Reasonable to Assume that Applied Materials, Inc. (NASDAQ:AMAT) has Peaked
Applied Materials, Inc. (NASDAQ:AMAT) posted its 3rd Quarter Earnings Update on 19th Aug. The company made US$21.6 in trailing twelve months revenues, amounting to a growth of 32.5%. Applied Materials also increased its profit margin to 24.5%, which is great for investors. With all the demand for their products and growth of the company, we wanted to see how this is reflected in the intrinsic value of the stock.
It seems that analysts are quite optimistic on the company, and estimate further revenue growth by 6.4%, and earnings growth by 9.7%. Both rates are a bit lower than the industry, which indicates a slowdown in the future.
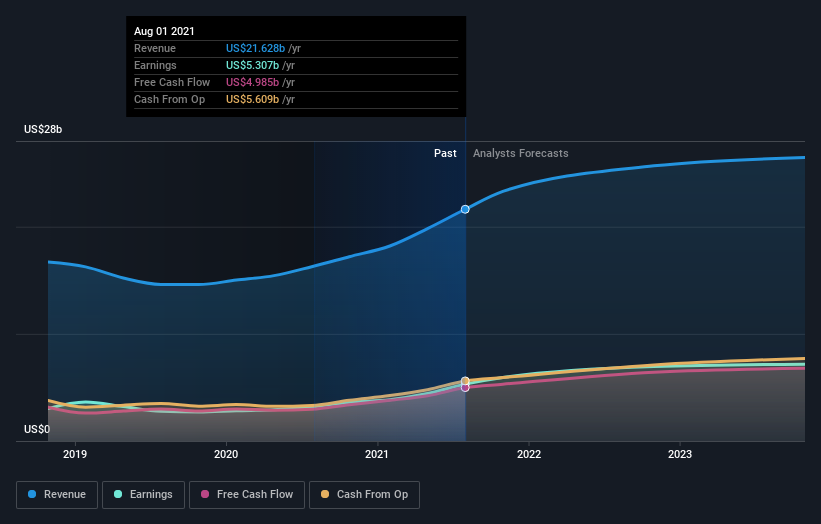
Two things are obvious from the chart above. The analysts estimate some growth up to 2023, and a peak of revenues after that, When a company has peaked its growth phase, it is important for investors to turn to the cash flows and margins. That way we can see the value of the future cash flows in today's price.
This is what a valuation essentially answers: How much are the cash flows of a company worth today. Not a year from now, not the potential value, but the value today.
We will run through one way of estimating the intrinsic value of Applied Materials, using the Discounted Cash Flow (DCF) model. Believe it or not, it's not too difficult to follow, as you'll see from our example!
Remember though, that there are many ways to estimate a company's value, and a DCF is just one method. If you still have some burning questions about this type of valuation, take a look at the Simply Wall St analysis model.
See our latest analysis for Applied Materials
Is Applied Materials Fairly Valued?
We are going to use a two-stage DCF model, which, as the name states, takes into account two stages of growth. The first stage is generally a higher growth period which levels off heading towards the terminal value, captured in the second 'steady growth' period. To start off with, we need to estimate the next ten years of cash flows. Where possible we use analyst estimates, but when these aren't available we extrapolate the previous free cash flow (FCF) from the last estimate or reported value. We assume companies with shrinking free cash flow will slow their rate of shrinkage, and that companies with growing free cash flow will see their growth rate slow, over this period. We do this to reflect that growth tends to slow more in the early years than it does in later years.
Generally we assume that a dollar today is more valuable than a dollar in the future, so we discount the value of these future cash flows to their estimated value in today's dollars:
10-year free cash flow (FCF) forecast
| 2022 | 2023 | 2024 | 2025 | 2026 | 2027 | 2028 | 2029 | 2030 | 2031 | |
| Levered FCF ($, Millions) | US$6.45b | US$6.87b | US$7.43b | US$7.78b | US$8.06b | US$8.31b | US$8.55b | US$8.76b | US$8.97b | US$9.17b |
| Growth Rate Estimate Source | Analyst x10 | Analyst x7 | Analyst x2 | Analyst x1 | Est @ 3.6% | Est @ 3.12% | Est @ 2.78% | Est @ 2.54% | Est @ 2.38% | Est @ 2.26% |
| Present Value ($, Millions) Discounted @ 7.4% | US$6.0k | US$6.0k | US$6.0k | US$5.9k | US$5.6k | US$5.4k | US$5.2k | US$5.0k | US$4.7k | US$4.5k |
("Est" = FCF growth rate estimated by Simply Wall St)
Present Value of 10-year Cash Flow (PVCF) = US$54b
We now need to calculate the Terminal Value, which accounts for all the future cash flows after this ten year period. For a number of reasons, a very conservative growth rate is used that cannot exceed that of a country's GDP growth. In this case we have used the 5-year average of the 10-year government bond yield (2.0%) to estimate future growth. In the same way as with the 10-year 'growth' period, we discount future cash flows to today's value, using a cost of equity of 7.4%.
Terminal Value (TV)= FCF2031 × (1 + g) ÷ (r * g) = US$9.2b× (1 + 2.0%) ÷ (7.4% * 2.0%) = US$173b
Present Value of Terminal Value (PVTV)= TV / (1 + r)10= US$173b÷ ( 1 + 7.4%)10= US$85b
The total value is the sum of cash flows for the next ten years plus the discounted terminal value, which results in the Total Equity Value, which in this case is US$139b.
The last step is to then divide the equity value by the number of shares outstanding.
Compared to the current share price of US$137, the company appears about fair value at a 10% discount to where the stock price trades currently. The assumptions in any calculation have a big impact on the valuation, so it is better to view this as a rough estimate, not precise down to the last cent.

Important assumptions
The calculation above is very dependent on two assumptions. The first is the discount rate and the other is the cash flows. Part of investing is coming up with your own evaluation of a company's future performance, so try the calculation yourself and check your own assumptions. The DCF also does not consider the possible cyclicality of an industry, or a company's future capital requirements, so it does not give a full picture of a company's potential performance.
Given that we are looking at Applied Materials as potential shareholders, the cost of equity is used as the discount rate, rather than the cost of capital (or weighted average cost of capital, WACC) which accounts for debt. In this calculation we've used 7.4%, which is based on a levered beta of 1.144. Beta is a measure of a stock's volatility, compared to the market as a whole. We get our beta from the industry average beta of globally comparable companies, with an imposed limit between 0.8 and 2.0, which is a reasonable range for a stable business.
Conclusion & Next Steps:
Applied Materials seems to be trading at roughly its intrinsic value - keep in mind that this is a model with some assumptions of future growth and profitability.
Even though the company posted strong growth from the last quarter, it seems that it is already priced in the stock, and very little upside can be found using our DCF calculations.
Whilst important, the DCF calculation is only one of many factors that you need to assess for a company. It's not possible to obtain a foolproof valuation with a DCF model. Instead, the best use for a DCF model is to test certain assumptions and theories to see if they would lead to the company being undervalued or overvalued. If a company grows at a different rate, or if its cost of equity or risk free rate changes sharply, the output can look very different.
For Applied Materials, we've put together three essential aspects you should further examine:
- Risks: For instance, we've identified 2 warning signs for Applied Materials that you should be aware of.
- Other Solid Businesses: Low debt, high returns on equity and good past performance are fundamental to a strong business. Why not explore our interactive list of stocks with solid business fundamentals to see if there are other companies you may not have considered!
PS. Simply Wall St updates its DCF calculation for every American stock every day, so if you want to find the intrinsic value of any other stock just search here.
Mobile Infrastructure for Defense and Disaster
The next wave in robotics isn't humanoid. Its fully autonomous towers delivering 5G, ISR, and radar in under 30 minutes, anywhere.
Get the investor briefing before the next round of contracts
Sponsored On Behalf of CiTechNew: Manage All Your Stock Portfolios in One Place
We've created the ultimate portfolio companion for stock investors, and it's free.
• Connect an unlimited number of Portfolios and see your total in one currency
• Be alerted to new Warning Signs or Risks via email or mobile
• Track the Fair Value of your stocks
Have feedback on this article? Concerned about the content? Get in touch with us directly. Alternatively, email editorial-team@simplywallst.com
Simply Wall St analyst Goran Damchevski and Simply Wall St have no position in any of the companies mentioned. This article is general in nature. We provide commentary based on historical data and analyst forecasts only using an unbiased methodology and our articles are not intended to be financial advice. It does not constitute a recommendation to buy or sell any stock and does not take account of your objectives, or your financial situation. We aim to bring you long-term focused analysis driven by fundamental data. Note that our analysis may not factor in the latest price-sensitive company announcements or qualitative material.

Goran Damchevski
Goran is an Equity Analyst and Writer at Simply Wall St with over 5 years of experience in financial analysis and company research. Goran previously worked in a seed-stage startup as a capital markets research analyst and product lead and developed a financial data platform for equity investors.
About NasdaqGS:AMAT
Applied Materials
Engages in the provision of manufacturing equipment, services, and software to the semiconductor, display, and related industries.
Flawless balance sheet and fair value.
Similar Companies
Market Insights

Weekly Picks

THE KINGDOM OF BROWN GOODS: WHY MGPI IS BEING CRUSHED BY INVENTORY & PRIMED FOR RESURRECTION


Why Vertical Aerospace (NYSE: EVTL) is Worth Possibly Over 13x its Current Price


The Quiet Giant That Became AI’s Power Grid
Recently Updated Narratives


A tech powerhouse quietly powering the world’s AI infrastructure.


Keppel DC REIT (SGX: AJBU) is a resilient gem in the data center space.
Why Vertical Aerospace (NYSE: EVTL) is Worth Possibly Over 13x its Current Price
Popular Narratives

MicroVision will explode future revenue by 380.37% with a vision towards success


Crazy Undervalued 42 Baggers Silver Play (Active & Running Mine)


