Advertisement
- United States
- /
- Semiconductors
- /
- NasdaqGS:AMAT
By Executing on Earnings, Applied Materials, Inc. (NASDAQ:AMAT) is Demonstrating Stability for Investors
Analysis summary:
- Our PE price target estimate closely corresponds with analyst's price targets of 133 per share.
- AMAT beat EPS estimates and is projected to have stable earnings in the next 2 years.
- Risk factors, such as the medium 75% convergence of earnings to cash, may be pressuring the stock.
Applied Materials, Inc. (NASDAQ:AMAT) managed to beat earnings expectations and showed some top line growth. While performing on earnings is great, we need to know what this means for the company's value. In this analysis, we will put AMAT's performance into context with the future and walkthrough one approach for estimating a price target for the stock.
Earnings Review
In their latest earnings report AMAT reported a solid top line growth and beat analysts' EPS estimates. Here are the highlights of the report:
- Revenue of $6.52b, up 5% year over year.
- Gross margin of 46.1%, down from 48% YoY. Operating margin down 3% to 29.5%
- Net income $1.606, down 6% YoY
- Diluted EPS $1.85, down 1% YoY.
- Non-GAAP EPS $1.94, down 2% YoY. Beating the estimated $1.79 by 8.4%.
- Cash from operations of $1.47b.
The company indicates that they are handling the current economic landscape well and are en route to stabilize and grow. In a prepared remark, the CEO said: “We feel confident in our ability to navigate macroeconomic headwinds and remain very positive about the long-term strength of the semiconductor market and our outsized growth opportunities”. However, given the company's performance, analysts are more inclined to expect a stabilization of income rather than large growth.
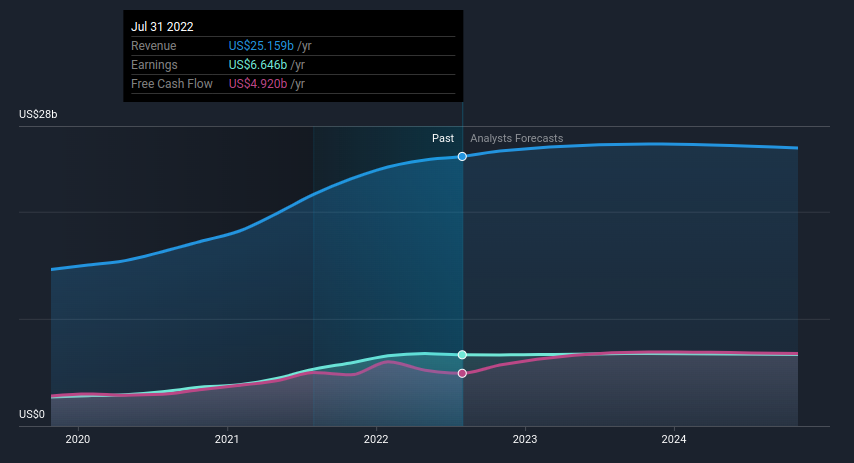
In the chart below, you can see the analysts' estimates in perspective:
Click the interactive chart for our full analysis
Outlook
Management has also given forward guidance for 2022. For the period, the company expects quarterly sales to be approximately $6.65b, plus or minus $400m, which includes the expected impact of ongoing supply chain challenges. AMAT expects Q4 EPS to be between $1.82 and $2.18.
On the other side, we have analysts estimates. On a trailing 12-month basis, AMAT is estimated to provide around $25b+ in revenue and $6.6b in net income going to the end of 2024.
What This Means For Investors
The stabilization of earnings gives investors the ability to evaluate AMAT with higher predictability. This means that we can take the average price to earnings ratio of peers and estimate the value of AMAT.
Here is how: We take the estimated net income for the next 12 months, divide it by 1 / average peer PE.
This becomes: $6.74b / (1 / 16.9) = 6.74 / 0.05917 = $113.9b
Compared to today's market cap, this would mean that the stock may have 25% upside - (estimated value / market cap - 1 = 113/91-1 = 25%. This corresponds well with analysts' 1-year price target of $133.37 as seen in the chart below:
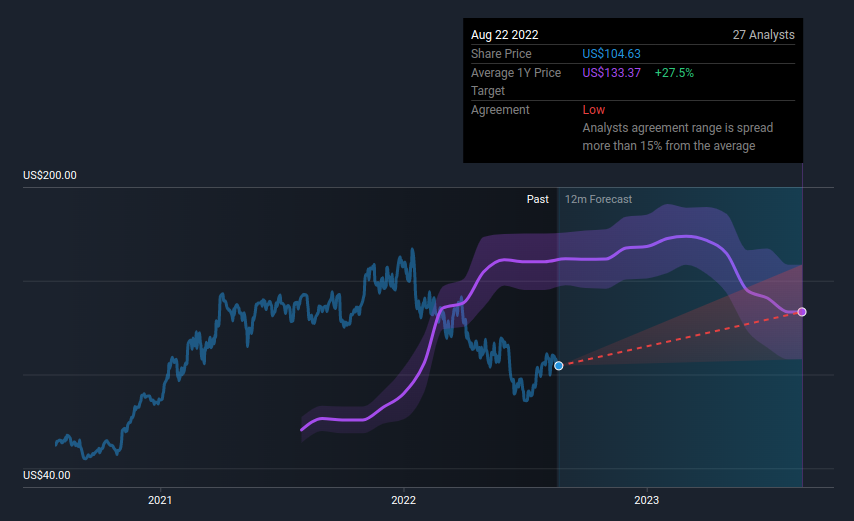
While we see that historically, AMAT's stock has closely followed analysts' price targets, we must be mindful of the multiple factors that can be keeping the stock price down.
These include:
The convergence rate of earnings to cash flows, i.e. what % of earnings are converted into cash for investors. In the first chart, we can see that currently, the company made $4.92b in free cash flows with $6.46b in earnings - this yields a convergence of 76%. While this may improve in the future, there is no guarantee, and for investors, the free cash flows are the real bottom line.
Current economic uncertainty and semiconductor industry-specific uncertainty - for example, supply chain issues are now likely the effect of government policies, rather than the global phenomenon from last year.
The rising cost of debt that has the potential to eat away earnings, AMAT maintains a debt balance of $5.456b, which may partly need to be refinanced at higher rates than those we have seen in 2021.
Next Steps
Investors can use multiple tools to assess the value of a company, besides peer P/E averages, we can use an industry average or a full DCF valuation. Be sure to check our full valuation of Applied Materials to see how these different approaches stack up against each other.
If you are a dividend investor, you might also want to look at our curated list of dividend stocks yielding above 3%.
New: Manage All Your Stock Portfolios in One Place
We've created the ultimate portfolio companion for stock investors, and it's free.
• Connect an unlimited number of Portfolios and see your total in one currency
• Be alerted to new Warning Signs or Risks via email or mobile
• Track the Fair Value of your stocks
Have feedback on this article? Concerned about the content? Get in touch with us directly. Alternatively, email editorial-team@simplywallst.com
Simply Wall St analyst Goran Damchevski and Simply Wall St have no position in any of the companies mentioned. This article is general in nature. We provide commentary based on historical data and analyst forecasts only using an unbiased methodology and our articles are not intended to be financial advice. It does not constitute a recommendation to buy or sell any stock and does not take account of your objectives, or your financial situation. We aim to bring you long-term focused analysis driven by fundamental data. Note that our analysis may not factor in the latest price-sensitive company announcements or qualitative material.

Goran Damchevski
Goran is an Equity Analyst and Writer at Simply Wall St with over 5 years of experience in financial analysis and company research. Goran previously worked in a seed-stage startup as a capital markets research analyst and product lead and developed a financial data platform for equity investors.
About NasdaqGS:AMAT
Applied Materials
Engages in the provision of manufacturing equipment, services, and software to the semiconductor, display, and related industries.
Flawless balance sheet average dividend payer.
Similar Companies
Market Insights

Advertisement
Community Narratives
Finding The True Value Of A Logistics Powerhouse
Fair Value US$95.21|8.4% undervalued
NV
Community Contributor
Paradigm Biopharmaceuticals Will Lead Osteoarthritis Treatment with Zilosul's FDA Success
Fair Value AU$5.50|91.9% undervalued
AM
Community Contributor
Barrick Mining (ABX:CA): A Gold Hedge against a U.S. Shutdown
Fair Value CA$60.00|24.2% undervalued
GM
Community Contributor