
Advertisement
The goal of this article is to teach you how to use price to earnings ratios (P/E ratios). We'll look at Tiffany & Co.'s (NYSE:TIF) P/E ratio and reflect on what it tells us about the company's share price. Tiffany has a P/E ratio of 19.93, based on the last twelve months. In other words, at today's prices, investors are paying $19.93 for every $1 in prior year profit.
See our latest analysis for Tiffany
How Do You Calculate Tiffany's P/E Ratio?
The formula for P/E is:
Price to Earnings Ratio = Share Price ÷ Earnings per Share (EPS)
Or for Tiffany:
P/E of 19.93 = $91.88 ÷ $4.61 (Based on the trailing twelve months to July 2019.)
Is A High P/E Ratio Good?
A higher P/E ratio implies that investors pay a higher price for the earning power of the business. That is not a good or a bad thing per se, but a high P/E does imply buyers are optimistic about the future.
Does Tiffany Have A Relatively High Or Low P/E For Its Industry?
The P/E ratio indicates whether the market has higher or lower expectations of a company. You can see in the image below that the average P/E (15.3) for companies in the specialty retail industry is lower than Tiffany's P/E.
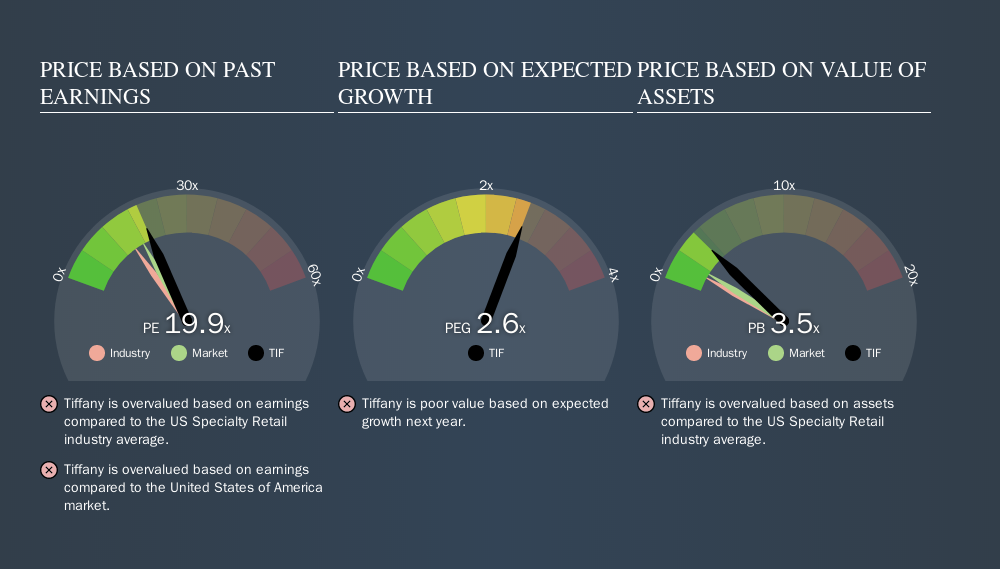
Tiffany's P/E tells us that market participants think the company will perform better than its industry peers, going forward. The market is optimistic about the future, but that doesn't guarantee future growth. So further research is always essential. I often monitor director buying and selling.
How Growth Rates Impact P/E Ratios
Earnings growth rates have a big influence on P/E ratios. When earnings grow, the 'E' increases, over time. And in that case, the P/E ratio itself will drop rather quickly. A lower P/E should indicate the stock is cheap relative to others -- and that may attract buyers.
It's nice to see that Tiffany grew EPS by a stonking 27% in the last year. And it has bolstered its earnings per share by 20% per year over the last five years. With that performance, I would expect it to have an above average P/E ratio.
Don't Forget: The P/E Does Not Account For Debt or Bank Deposits
One drawback of using a P/E ratio is that it considers market capitalization, but not the balance sheet. In other words, it does not consider any debt or cash that the company may have on the balance sheet. In theory, a company can lower its future P/E ratio by using cash or debt to invest in growth.
Such spending might be good or bad, overall, but the key point here is that you need to look at debt to understand the P/E ratio in context.
Is Debt Impacting Tiffany's P/E?
Tiffany has net debt worth just 3.1% of its market capitalization. It would probably trade on a higher P/E ratio if it had a lot of cash, but I doubt it is having a big impact.
The Bottom Line On Tiffany's P/E Ratio
Tiffany trades on a P/E ratio of 19.9, which is above its market average of 17.6. Its debt levels do not imperil its balance sheet and it is growing EPS strongly. So on this analysis it seems reasonable that its P/E ratio is above average.
Investors have an opportunity when market expectations about a stock are wrong. As value investor Benjamin Graham famously said, 'In the short run, the market is a voting machine but in the long run, it is a weighing machine. So this free visualization of the analyst consensus on future earnings could help you make the right decision about whether to buy, sell, or hold.
Of course you might be able to find a better stock than Tiffany. So you may wish to see this free collection of other companies that have grown earnings strongly.
We aim to bring you long-term focused research analysis driven by fundamental data. Note that our analysis may not factor in the latest price-sensitive company announcements or qualitative material.
If you spot an error that warrants correction, please contact the editor at editorial-team@simplywallst.com. This article by Simply Wall St is general in nature. It does not constitute a recommendation to buy or sell any stock, and does not take account of your objectives, or your financial situation. Simply Wall St has no position in the stocks mentioned. Thank you for reading.
Market Insights

Advertisement
Community Narratives
Quality at a Premium. A time to watch, not to buy?
Fair Value US$154.56|27.6% undervalued
DA
Community Contributor
GRAB: The Super-App at the Heart of Southeast Asia’s Digital Boom
Fair Value US$8.20|22.1% undervalued
BL
Community Contributor
Verve Group to Surge with 51.61% Revenue Growth
Fair Value €6.00|60.0% undervalued
ME
Community Contributor