Advertisement
- United States
- /
- Specialty Stores
- /
- NYSE:HD
Does Home Depot’s SRS Acquisition Make the Current Share Price Attractive in 2025?

Simply Wall St
Reviewed by Bailey Pemberton
If you are staring at Home Depot’s recent share price and wondering whether it is time to jump in, hold, or reconsider altogether, you are not alone. The stock has been anything but dull lately. After a modest 0.3% gain over the past week, the past month saw a 6.4% dip, barely breaking even year-to-date at 0.1%. Over the long haul, though, Home Depot still boasts a return of nearly 59% across five years. This hints at underlying resilience even as short-term turbulence plays out.
So, what is moving the needle? Earlier this year, investors responded to Home Depot’s announcement of plans to acquire SRS Distribution, a major building products distributor. Even though this news did not directly spike the share price, it signaled a company intent on expanding its reach into new markets and reinforcing its leadership in the home improvement world. At the same time, broader concerns around the housing market and interest rates have clouded investor sentiment and nudged the stock lower, despite strong long-term fundamentals.
If you are trying to gauge whether the current price represents an attractive entry point, a look at Home Depot’s valuation story helps clarify things. By standard measures, it checks just one out of six undervaluation boxes, giving it a value score of 1 on our scale. That may not sound impressive, but the real picture emerges only when we peel back the layers. Let’s dive into the main valuation tools analysts rely on. At the end, I will introduce a fresh way to think about what Home Depot is really worth.
Home Depot scores just 1/6 on our valuation checks. See what other red flags we found in the full valuation breakdown.
Approach 1: Home Depot Discounted Cash Flow (DCF) Analysis
The Discounted Cash Flow (DCF) model estimates what a company is truly worth by projecting its future cash flows and discounting them back to today's dollars. This approach helps determine whether the stock price reflects those future earnings, factoring in both the money the business generates now and what it could generate in the future.
For Home Depot, analysts estimate its last twelve months of Free Cash Flow (FCF) at $14.3 Billion. Looking ahead, projections suggest that Home Depot could be generating over $21.3 Billion in annual FCF by 2035, with $18.4 Billion seen as likely by 2030. While expert forecasts typically go out five years, further FCF growth is extrapolated based on recent growth patterns and industry trends.
Using these projections, the DCF model calculates an estimated fair value of $298.44 per share for Home Depot. However, with Home Depot's share price currently standing about 30.3% above this intrinsic value, the model implies the stock is overvalued at today's market levels.
Result: OVERVALUED

Our Discounted Cash Flow (DCF) analysis suggests Home Depot may be overvalued by 30.3%. Find undervalued stocks or create your own screener to find better value opportunities.
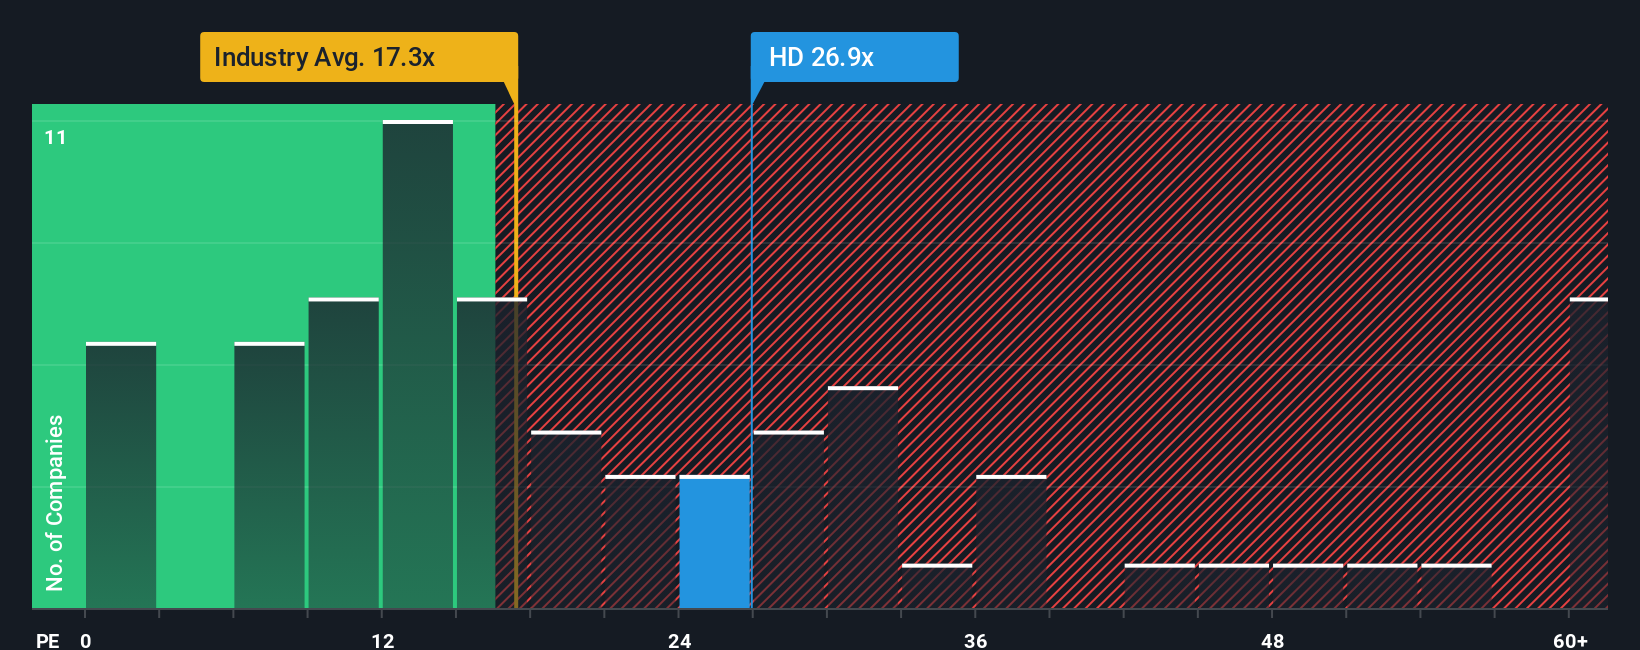
Approach 2: Home Depot Price vs Earnings
The Price-to-Earnings (PE) ratio is a popular valuation metric for profitable companies like Home Depot because it directly connects a stock’s price to the company’s actual earnings performance. It is especially useful for assessing established businesses with steady profits, helping investors judge whether the current price fairly reflects expectations for future growth and profitability.
A “normal” or “fair” PE ratio depends a lot on how quickly a company is expected to grow and the risks it faces. High-growth businesses and those in stable industries can often justify higher PE ratios, while companies with slower prospects or greater uncertainties tend to trade at lower multiples.
Currently, Home Depot’s PE ratio stands at 26.5x. This is not far from its peer group average of 26.8x, but substantially above the specialty retail industry average of 16.7x. To provide a more tailored benchmark, Simply Wall St calculates a “Fair Ratio,” which is an expected PE multiple based on Home Depot’s earnings growth, profitability, market cap, risk profile, and industry context. Home Depot’s Fair Ratio is 23.6x, which is slightly below its actual PE multiple.
The advantage of using the Fair Ratio rather than just industry or peer comparisons is that it incorporates several company-specific factors, making it a more nuanced and meaningful yardstick for valuation. This helps investors judge whether the current market price aligns with Home Depot’s unique growth and risk profile rather than simply following broader sector trends.
Given that Home Depot’s current PE ratio of 26.5x is within a reasonable range of its Fair Ratio of 23.6x, the valuation appears a little stretched, but not dramatically so.
Result: OVERVALUED
PE ratios tell one story, but what if the real opportunity lies elsewhere? Discover companies where insiders are betting big on explosive growth.
Upgrade Your Decision Making: Choose your Home Depot Narrative
Earlier we mentioned there is an even better way to understand valuation, so let’s introduce you to Narratives. Narratives are a simple yet powerful tool that let you shape and track your own story for a company. Your expectations for where revenues, earnings, and margins are headed, and what that means for fair value, tie your beliefs about Home Depot’s future directly to a forecast and a price target. Instead of just comparing static valuation ratios, Narratives allow you to connect the dots between your unique insights or hypotheses and what the numbers imply for the stock’s potential.
On Simply Wall St’s Community page, used by millions of investors, you can access and create Narratives that update automatically as new earnings or news comes in. This means your analysis stays relevant and adapts when the facts change, supporting better investment decisions. Narratives make it easy to compare fair value estimates with the current share price, so you can quickly see when your story tells you to buy, hold, or sell.
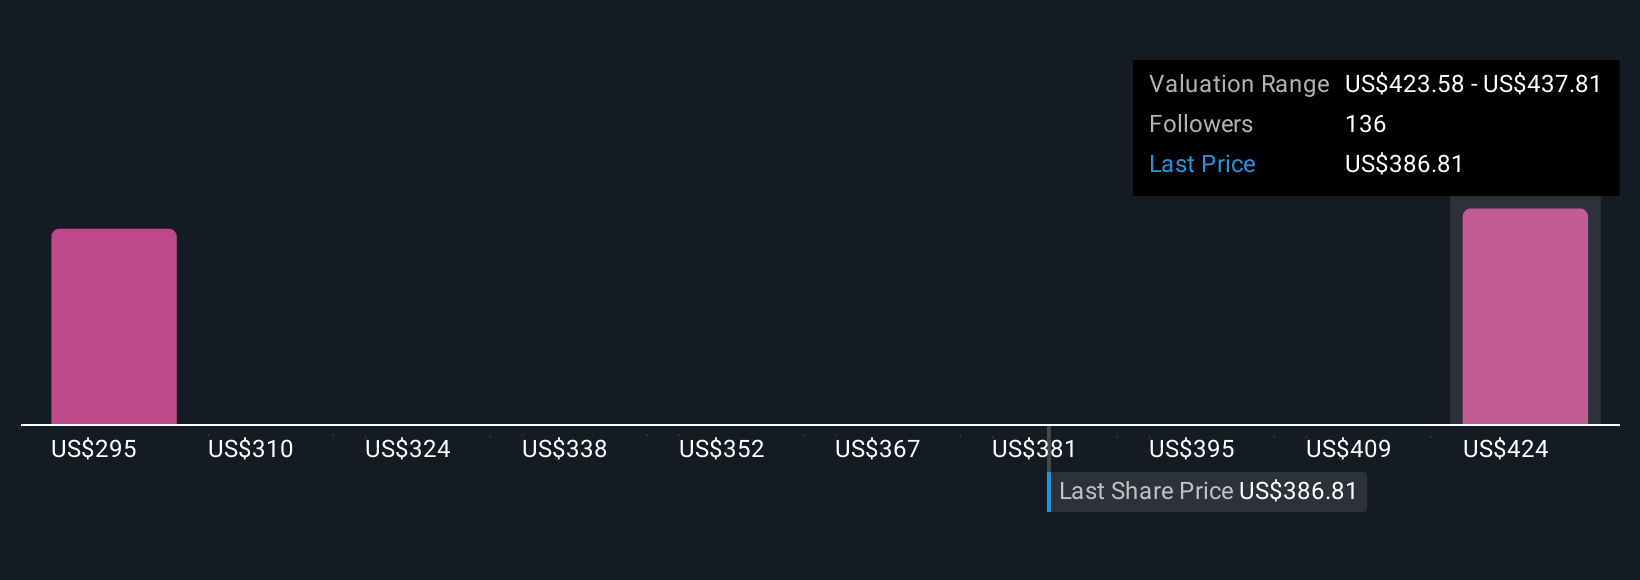
For example, within Home Depot’s Narratives, the most optimistic investors see technological innovation and resilient demand propelling the stock to as high as $481 per share, while cautious voices focus on profitability pressures and assign a much lower target of $335. Narratives let you cut through the noise and decide which outlook matches your beliefs, backed by dynamic, up-to-date data.
Do you think there's more to the story for Home Depot? Create your own Narrative to let the Community know!
This article by Simply Wall St is general in nature. We provide commentary based on historical data and analyst forecasts only using an unbiased methodology and our articles are not intended to be financial advice. It does not constitute a recommendation to buy or sell any stock, and does not take account of your objectives, or your financial situation. We aim to bring you long-term focused analysis driven by fundamental data. Note that our analysis may not factor in the latest price-sensitive company announcements or qualitative material. Simply Wall St has no position in any stocks mentioned.
Valuation is complex, but we're here to simplify it.
Discover if Home Depot might be undervalued or overvalued with our detailed analysis, featuring fair value estimates, potential risks, dividends, insider trades, and its financial condition.
Access Free AnalysisHave feedback on this article? Concerned about the content? Get in touch with us directly. Alternatively, email editorial-team@simplywallst.com
About NYSE:HD
Home Depot
Operates as a home improvement retailer in the United States and internationally.
Established dividend payer with adequate balance sheet.
Similar Companies
Market Insights

Advertisement
Community Narratives
Finding The True Value Of A Logistics Powerhouse
Fair Value US$95.21|8.7% undervalued
NV
Community Contributor
Paradigm Biopharmaceuticals Will Lead Osteoarthritis Treatment with Zilosul's FDA Success
Fair Value AU$5.50|93.3% undervalued
AM
Community Contributor
Barrick Mining (ABX:CA): A Gold Hedge against a U.S. Shutdown
Fair Value CA$60.00|18.7% undervalued
GM
Community Contributor