
Advertisement
- United States
- /
- Specialty Stores
- /
- NYSE:GPI
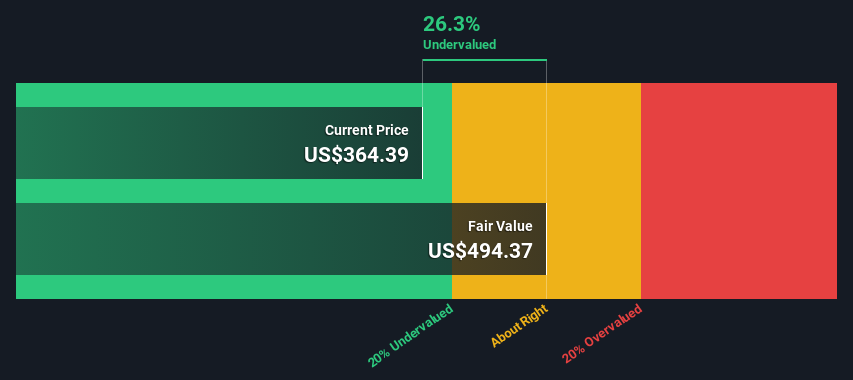
Group 1 Automotive, Inc. (NYSE:GPI) Shares Could Be 26% Below Their Intrinsic Value Estimate
Key Insights
- The projected fair value for Group 1 Automotive is US$494 based on 2 Stage Free Cash Flow to Equity
- Current share price of US$364 suggests Group 1 Automotive is potentially 26% undervalued
- The US$383 analyst price target for GPI is 22% less than our estimate of fair value
How far off is Group 1 Automotive, Inc. (NYSE:GPI) from its intrinsic value? Using the most recent financial data, we'll take a look at whether the stock is fairly priced by taking the forecast future cash flows of the company and discounting them back to today's value. We will use the Discounted Cash Flow (DCF) model on this occasion. Models like these may appear beyond the comprehension of a lay person, but they're fairly easy to follow.
Remember though, that there are many ways to estimate a company's value, and a DCF is just one method. For those who are keen learners of equity analysis, the Simply Wall St analysis model here may be something of interest to you.
See our latest analysis for Group 1 Automotive
Step By Step Through The Calculation
We are going to use a two-stage DCF model, which, as the name states, takes into account two stages of growth. The first stage is generally a higher growth period which levels off heading towards the terminal value, captured in the second 'steady growth' period. To start off with, we need to estimate the next ten years of cash flows. Where possible we use analyst estimates, but when these aren't available we extrapolate the previous free cash flow (FCF) from the last estimate or reported value. We assume companies with shrinking free cash flow will slow their rate of shrinkage, and that companies with growing free cash flow will see their growth rate slow, over this period. We do this to reflect that growth tends to slow more in the early years than it does in later years.
A DCF is all about the idea that a dollar in the future is less valuable than a dollar today, and so the sum of these future cash flows is then discounted to today's value:
10-year free cash flow (FCF) estimate
| 2025 | 2026 | 2027 | 2028 | 2029 | 2030 | 2031 | 2032 | 2033 | 2034 | |
| Levered FCF ($, Millions) | US$460.9m | US$454.9m | US$454.5m | US$457.6m | US$463.3m | US$470.7m | US$479.6m | US$489.5m | US$500.2m | US$511.7m |
| Growth Rate Estimate Source | Analyst x2 | Analyst x1 | Est @ -0.09% | Est @ 0.69% | Est @ 1.23% | Est @ 1.61% | Est @ 1.88% | Est @ 2.07% | Est @ 2.20% | Est @ 2.29% |
| Present Value ($, Millions) Discounted @ 9.0% | US$423 | US$383 | US$351 | US$325 | US$302 | US$281 | US$263 | US$246 | US$231 | US$217 |
("Est" = FCF growth rate estimated by Simply Wall St)
Present Value of 10-year Cash Flow (PVCF) = US$3.0b
After calculating the present value of future cash flows in the initial 10-year period, we need to calculate the Terminal Value, which accounts for all future cash flows beyond the first stage. For a number of reasons a very conservative growth rate is used that cannot exceed that of a country's GDP growth. In this case we have used the 5-year average of the 10-year government bond yield (2.5%) to estimate future growth. In the same way as with the 10-year 'growth' period, we discount future cash flows to today's value, using a cost of equity of 9.0%.
Terminal Value (TV)= FCF2034 × (1 + g) ÷ (r – g) = US$512m× (1 + 2.5%) ÷ (9.0%– 2.5%) = US$8.1b
Present Value of Terminal Value (PVTV)= TV / (1 + r)10= US$8.1b÷ ( 1 + 9.0%)10= US$3.4b
The total value, or equity value, is then the sum of the present value of the future cash flows, which in this case is US$6.5b. To get the intrinsic value per share, we divide this by the total number of shares outstanding. Relative to the current share price of US$364, the company appears a touch undervalued at a 26% discount to where the stock price trades currently. The assumptions in any calculation have a big impact on the valuation, so it is better to view this as a rough estimate, not precise down to the last cent.
The Assumptions
Now the most important inputs to a discounted cash flow are the discount rate, and of course, the actual cash flows. You don't have to agree with these inputs, I recommend redoing the calculations yourself and playing with them. The DCF also does not consider the possible cyclicality of an industry, or a company's future capital requirements, so it does not give a full picture of a company's potential performance. Given that we are looking at Group 1 Automotive as potential shareholders, the cost of equity is used as the discount rate, rather than the cost of capital (or weighted average cost of capital, WACC) which accounts for debt. In this calculation we've used 9.0%, which is based on a levered beta of 1.567. Beta is a measure of a stock's volatility, compared to the market as a whole. We get our beta from the industry average beta of globally comparable companies, with an imposed limit between 0.8 and 2.0, which is a reasonable range for a stable business.
SWOT Analysis for Group 1 Automotive
Strength
- Debt is well covered by earnings.
Weakness
- Earnings declined over the past year.
- Dividend is low compared to the top 25% of dividend payers in the Specialty Retail market.
Opportunity
- Annual earnings are forecast to grow for the next 3 years.
- Good value based on P/E ratio and estimated fair value.
Threat
- Debt is not well covered by operating cash flow.
- Annual earnings are forecast to grow slower than the American market.
Moving On:
Although the valuation of a company is important, it shouldn't be the only metric you look at when researching a company. The DCF model is not a perfect stock valuation tool. Rather it should be seen as a guide to "what assumptions need to be true for this stock to be under/overvalued?" For instance, if the terminal value growth rate is adjusted slightly, it can dramatically alter the overall result. Can we work out why the company is trading at a discount to intrinsic value? For Group 1 Automotive, we've put together three further aspects you should further examine:
- Risks: Case in point, we've spotted 2 warning signs for Group 1 Automotive you should be aware of, and 1 of them shouldn't be ignored.
- Management:Have insiders been ramping up their shares to take advantage of the market's sentiment for GPI's future outlook? Check out our management and board analysis with insights on CEO compensation and governance factors.
- Other Solid Businesses: Low debt, high returns on equity and good past performance are fundamental to a strong business. Why not explore our interactive list of stocks with solid business fundamentals to see if there are other companies you may not have considered!
PS. Simply Wall St updates its DCF calculation for every American stock every day, so if you want to find the intrinsic value of any other stock just search here.
New: Manage All Your Stock Portfolios in One Place
We've created the ultimate portfolio companion for stock investors, and it's free.
• Connect an unlimited number of Portfolios and see your total in one currency
• Be alerted to new Warning Signs or Risks via email or mobile
• Track the Fair Value of your stocks
Have feedback on this article? Concerned about the content? Get in touch with us directly. Alternatively, email editorial-team (at) simplywallst.com.
This article by Simply Wall St is general in nature. We provide commentary based on historical data and analyst forecasts only using an unbiased methodology and our articles are not intended to be financial advice. It does not constitute a recommendation to buy or sell any stock, and does not take account of your objectives, or your financial situation. We aim to bring you long-term focused analysis driven by fundamental data. Note that our analysis may not factor in the latest price-sensitive company announcements or qualitative material. Simply Wall St has no position in any stocks mentioned.
About NYSE:GPI
Group 1 Automotive
Through its subsidiaries, operates in the automotive retail industry in the United States and the United Kingdom.
Slight risk and fair value.
Similar Companies
Market Insights

Advertisement
Community Narratives
MicroVision will explode future revenue by 380.37% with a vision towards success
Fair Value US$60.00|98.4% undervalued
TH
Community Contributor
The Indispensable Artery for a New North American Economy
Fair Value CA$132.87|1.1% undervalued
TI
Community Contributor