
Advertisement
- United States
- /
- Specialty Stores
- /
- NYSE:FL
Foot Locker, Inc.'s (NYSE:FL) Shares Climb 26% But Its Business Is Yet to Catch Up
Foot Locker, Inc. (NYSE:FL) shareholders are no doubt pleased to see that the share price has bounced 26% in the last month, although it is still struggling to make up recently lost ground. Longer-term shareholders would be thankful for the recovery in the share price since it's now virtually flat for the year after the recent bounce.
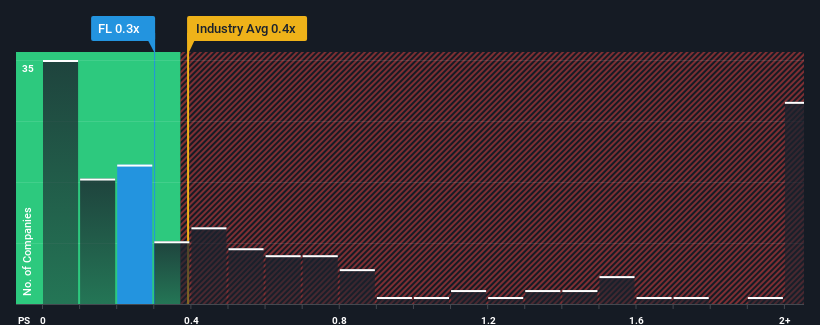
In spite of the firm bounce in price, there still wouldn't be many who think Foot Locker's price-to-sales (or "P/S") ratio of 0.3x is worth a mention when the median P/S in the United States' Specialty Retail industry is similar at about 0.4x. While this might not raise any eyebrows, if the P/S ratio is not justified investors could be missing out on a potential opportunity or ignoring looming disappointment.
See our latest analysis for Foot Locker
How Has Foot Locker Performed Recently?
While the industry has experienced revenue growth lately, Foot Locker's revenue has gone into reverse gear, which is not great. It might be that many expect the dour revenue performance to strengthen positively, which has kept the P/S from falling. You'd really hope so, otherwise you're paying a relatively elevated price for a company with this sort of growth profile.
If you'd like to see what analysts are forecasting going forward, you should check out our free report on Foot Locker.What Are Revenue Growth Metrics Telling Us About The P/S?
There's an inherent assumption that a company should be matching the industry for P/S ratios like Foot Locker's to be considered reasonable.
Taking a look back first, the company's revenue growth last year wasn't something to get excited about as it posted a disappointing decline of 6.6%. That put a dampener on the good run it was having over the longer-term as its three-year revenue growth is still a noteworthy 8.1% in total. Although it's been a bumpy ride, it's still fair to say the revenue growth recently has been mostly respectable for the company.
Looking ahead now, revenue is anticipated to slump, contracting by 0.6% during the coming year according to the analysts following the company. Meanwhile, the broader industry is forecast to expand by 3.7%, which paints a poor picture.
With this information, we find it concerning that Foot Locker is trading at a fairly similar P/S compared to the industry. Apparently many investors in the company reject the analyst cohort's pessimism and aren't willing to let go of their stock right now. Only the boldest would assume these prices are sustainable as these declining revenues are likely to weigh on the share price eventually.
What Does Foot Locker's P/S Mean For Investors?
Its shares have lifted substantially and now Foot Locker's P/S is back within range of the industry median. While the price-to-sales ratio shouldn't be the defining factor in whether you buy a stock or not, it's quite a capable barometer of revenue expectations.
While Foot Locker's P/S isn't anything out of the ordinary for companies in the industry, we didn't expect it given forecasts of revenue decline. When we see a gloomy outlook like this, our immediate thoughts are that the share price is at risk of declining, negatively impacting P/S. If the poor revenue outlook tells us one thing, it's that these current price levels could be unsustainable.
There are also other vital risk factors to consider before investing and we've discovered 1 warning sign for Foot Locker that you should be aware of.
Of course, profitable companies with a history of great earnings growth are generally safer bets. So you may wish to see this free collection of other companies that have reasonable P/E ratios and have grown earnings strongly.
New: AI Stock Screener & Alerts
Our new AI Stock Screener scans the market every day to uncover opportunities.
• Dividend Powerhouses (3%+ Yield)
• Undervalued Small Caps with Insider Buying
• High growth Tech and AI Companies
Or build your own from over 50 metrics.
Have feedback on this article? Concerned about the content? Get in touch with us directly. Alternatively, email editorial-team (at) simplywallst.com.
This article by Simply Wall St is general in nature. We provide commentary based on historical data and analyst forecasts only using an unbiased methodology and our articles are not intended to be financial advice. It does not constitute a recommendation to buy or sell any stock, and does not take account of your objectives, or your financial situation. We aim to bring you long-term focused analysis driven by fundamental data. Note that our analysis may not factor in the latest price-sensitive company announcements or qualitative material. Simply Wall St has no position in any stocks mentioned.
About NYSE:FL
Foot Locker
Through its subsidiaries, operates as a footwear and apparel retailer in North America, Europe, the Middle East, Africa, Asia Pacific, and internationally.
Adequate balance sheet with moderate growth potential.
Similar Companies
Market Insights

Advertisement
Community Narratives
Groundbreaking therapies that could change the treatment landscape for PTSD, fibromyalgia, MS & Alzheimer’s
Fair Value US$6.20|86.9% undervalued
CM
Community Contributor
DigitalOcean Will Grow 14% by Embracing AI with Paperspace Acquisition
Fair Value US$50.00|42.8% undervalued
NE
Community Contributor
Viant Technology: A Rising AdTech Challenger in the AI-Powered CTV Market
Fair Value US$38.61|66.0% undervalued
BL
Community Contributor
Volvo will Accelerate Forward into Electric and Autonomous Leadership in Five Years
Fair Value SEK 438.80|40.8% undervalued
UN
Community Contributor