Advertisement
- United States
- /
- Specialty Stores
- /
- NYSE:CVNA
Assessing Carvana’s Value After 18% Drop Despite Bold Expansion Moves

Simply Wall St
Reviewed by Bailey Pemberton
- Ever wondered if Carvana’s rapid growth has made it a bargain or left it overvalued? Let’s dive into what the stock’s recent run really means for those searching for value.
- Carvana shares are up an impressive 53.6% year-to-date and have skyrocketed nearly 3400% over the last three years, but the past month has seen a sharp pullback of 18.4%.
- Fueling these swings, Carvana has grabbed headlines with bold moves to expand its e-commerce platform and tackle automotive industry disruptions, including recent partnerships that aim to redefine car buying and selling online. These headlines have excited some investors while making others question if the company’s rally is sustainable.
- On our valuation check, Carvana scores just 1 out of 6 for being undervalued, so a closer look at how analysts value Carvana is a must. We will walk through those approaches now. Stay tuned for a deeper, potentially better, way to think about valuation at the end.
Carvana scores just 1/6 on our valuation checks. See what other red flags we found in the full valuation breakdown.
Approach 1: Carvana Discounted Cash Flow (DCF) Analysis
The Discounted Cash Flow (DCF) model estimates a company's value by extrapolating its expected future cash flows and discounting them back to today, reflecting both time and risk. This model involves forecasting how much cash Carvana will generate over time and figuring out what those future dollars are worth right now.
For Carvana, the current Free Cash Flow is $520.3 million. Analyst estimates suggest Carvana’s annual free cash flow will grow rapidly, reaching $2.65 billion by 2029. Over the next decade, further projections up to 2035, based on both analyst estimates and Simply Wall St’s extrapolations, show even more aggressive gains, peaking above $4.3 billion in future free cash flow.
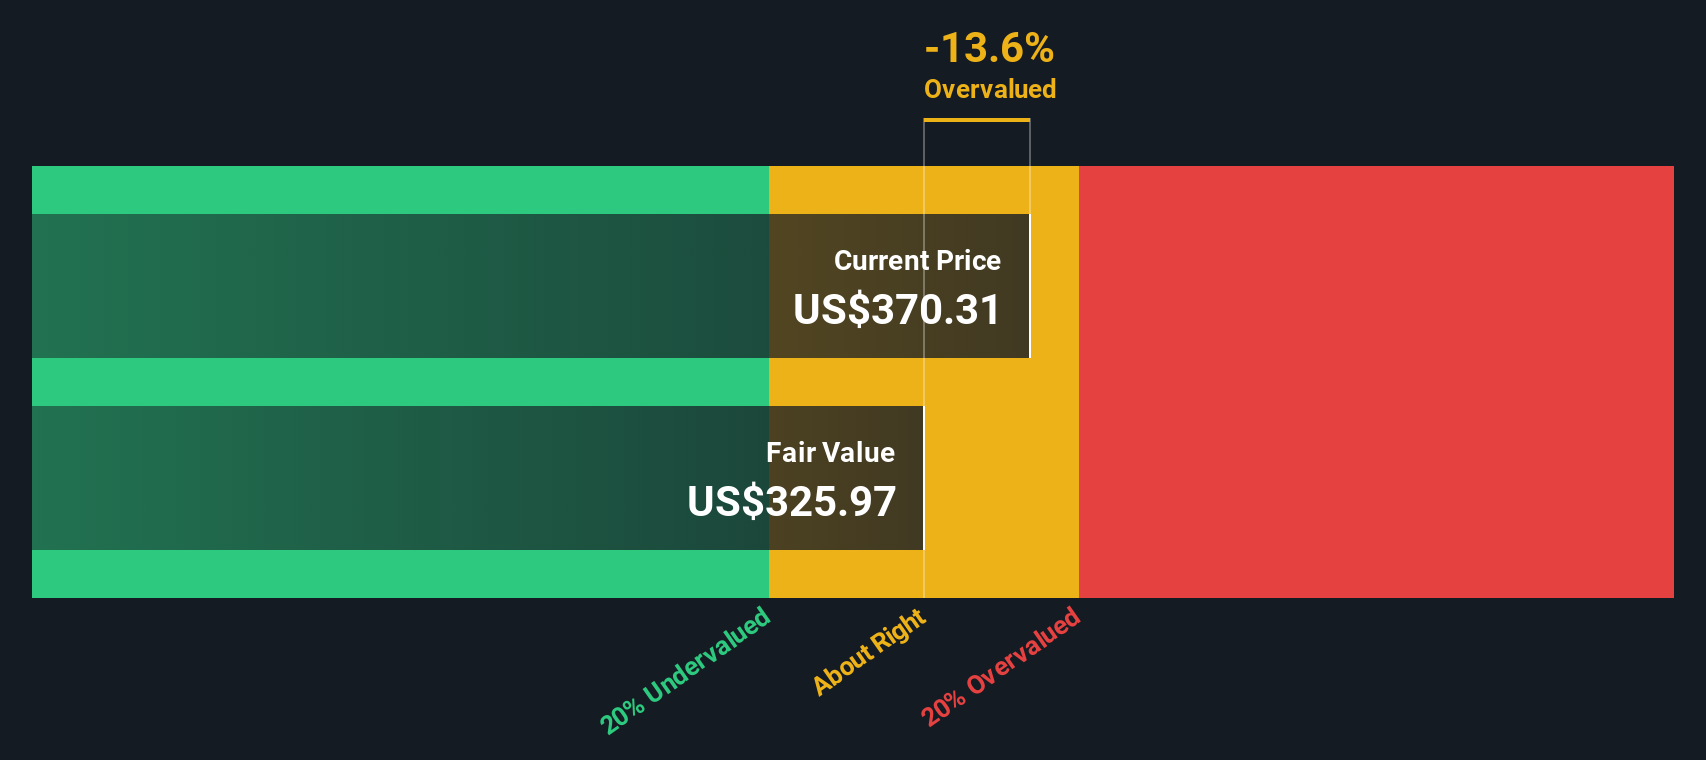
After applying the DCF analysis using the 2 Stage Free Cash Flow to Equity model, Carvana's estimated intrinsic value comes in at $263.51 per share. However, there is a catch: this valuation suggests the current market price is actually about 16.3% higher than what the cash flow projections support. In other words, according to this DCF approach, Carvana’s stock is overvalued at present.
Result: OVERVALUED
Our Discounted Cash Flow (DCF) analysis suggests Carvana may be overvalued by 16.3%. Discover 840 undervalued stocks or create your own screener to find better value opportunities.
Approach 2: Carvana Price vs Earnings
The Price-to-Earnings (PE) ratio is a go-to valuation tool for profitable companies, as it compares what investors are paying per dollar of earnings. It is especially useful because it combines growth prospects and profitability, helping investors gauge whether a stock commands a premium for good reasons.
What counts as a “normal” PE ratio can change based on how quickly a company’s earnings are expected to grow as well as the risks it faces along the way. High-growth or lower-risk companies tend to justify higher PE multiples, while slower-growth or riskier businesses generally trade at a discount.
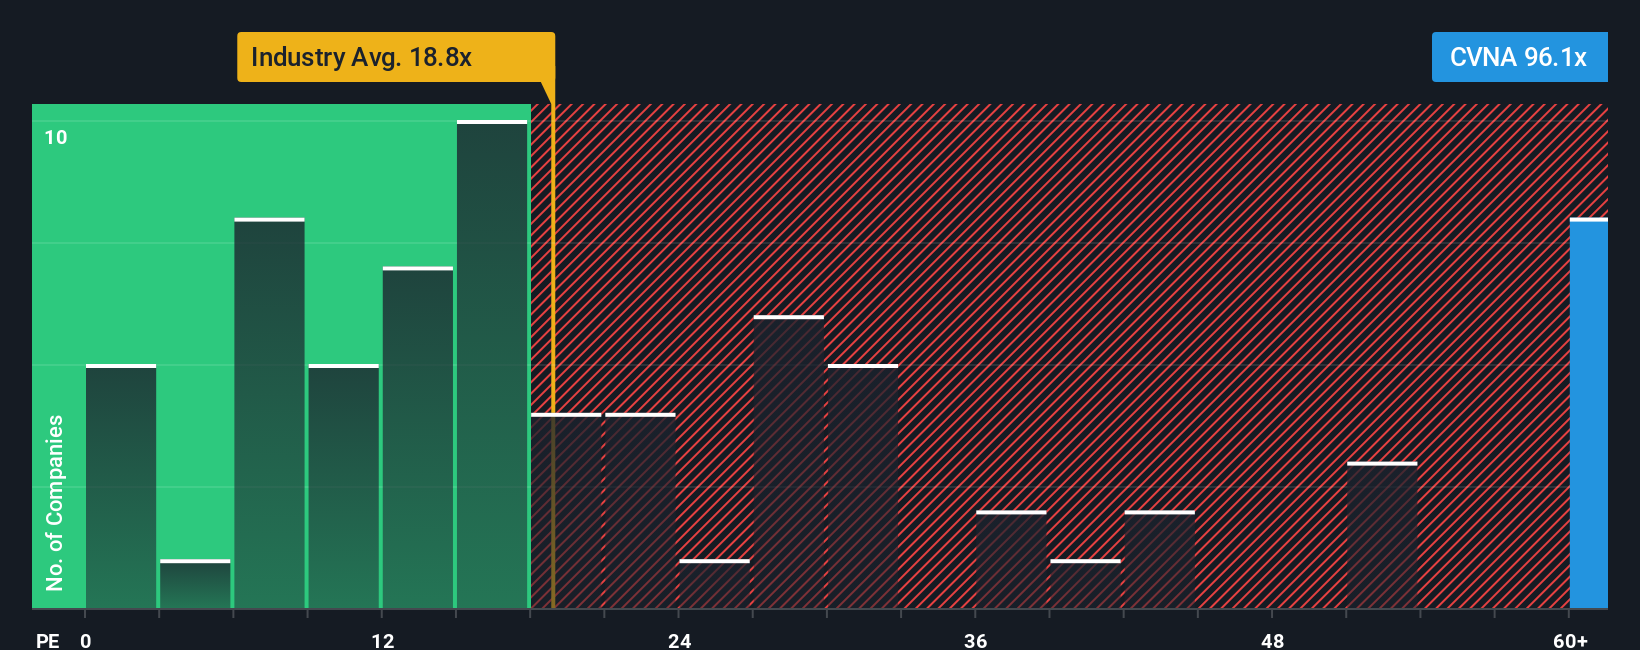
Right now, Carvana’s PE ratio sits at 68.9x, far above the Specialty Retail industry average of 16.7x and well above its peers’ average of 19.1x. On the surface, this large multiple suggests the market is extremely optimistic about Carvana’s potential.
This is where Simply Wall St’s proprietary Fair Ratio comes in. It calculates the “right” PE ratio for a given stock, considering not just growth and profitability but also risks, margins, industry factors, and company size. This helps move beyond broad benchmarks to a more tailored comparison. For Carvana, the Fair Ratio is 35.9x. Compared to the actual PE, this signals that the market is pricing in even more optimism than fundamentals warrant.
Result: OVERVALUED
PE ratios tell one story, but what if the real opportunity lies elsewhere? Discover 1415 companies where insiders are betting big on explosive growth.
Upgrade Your Decision Making: Choose your Carvana Narrative
Earlier we mentioned that there is an even better way to understand valuation, so let’s introduce you to Narratives. A Narrative is simply the story you, or anyone in the investing community, believe about a company. This links your perspective (for example, on Carvana’s e-commerce strengths or sector risks) directly to your own financial assumptions like future revenue, profit margins, and what you think the fair value should be.
When you use Narratives on Simply Wall St’s Community page, this story-driven approach connects the company’s real-world journey with a clear forecast and a personalized fair value, making decision-making far more intuitive than just looking at numbers. Narratives give you an accessible and powerful tool used by millions of investors, helping you quickly compare Fair Value and share price so you can decide if now is the right time to buy, sell, or watch. Plus, Narratives are refreshed automatically whenever new data or news comes in, so your investment view stays current.
For Carvana, this means one investor might believe in aggressive online growth and price the stock at $500, while another sees risks in competition and sets a conservative value closer to $330. Your Narrative lets you decide which story you trust most.
Do you think there's more to the story for Carvana? Head over to our Community to see what others are saying!
This article by Simply Wall St is general in nature. We provide commentary based on historical data and analyst forecasts only using an unbiased methodology and our articles are not intended to be financial advice. It does not constitute a recommendation to buy or sell any stock, and does not take account of your objectives, or your financial situation. We aim to bring you long-term focused analysis driven by fundamental data. Note that our analysis may not factor in the latest price-sensitive company announcements or qualitative material. Simply Wall St has no position in any stocks mentioned.
New: AI Stock Screener & Alerts
Our new AI Stock Screener scans the market every day to uncover opportunities.
• Dividend Powerhouses (3%+ Yield)
• Undervalued Small Caps with Insider Buying
• High growth Tech and AI Companies
Or build your own from over 50 metrics.
Have feedback on this article? Concerned about the content? Get in touch with us directly. Alternatively, email editorial-team@simplywallst.com
About NYSE:CVNA
Carvana
Operates an e-commerce platform for buying and selling used cars in the United States.
Exceptional growth potential with solid track record.
Similar Companies
Market Insights

Advertisement
Community Narratives
The company that turned a verb into a global necessity and basically runs the modern internet, digital ads, smartphones, maps, and AI.
Fair Value US$300.00|6.3% undervalued
OS
Community Contributor
Flowers Foods Pays A Fair Price For Health
Fair Value US$16.12|26.0% undervalued
NV
Community Contributor
TMX Group will thrive with 33.3% profit margin and enduring market moat
Fair Value CA$49.90|3.7% overvalued
LI
Community Contributor