
Advertisement
- United States
- /
- Specialty Stores
- /
- NYSE:BBY
There Are Reasons To Feel Uneasy About Best Buy's (NYSE:BBY) Returns On Capital

If you're not sure where to start when looking for the next multi-bagger, there are a few key trends you should keep an eye out for. Typically, we'll want to notice a trend of growing return on capital employed (ROCE) and alongside that, an expanding base of capital employed. Put simply, these types of businesses are compounding machines, meaning they are continually reinvesting their earnings at ever-higher rates of return. So while Best Buy (NYSE:BBY) has a high ROCE right now, lets see what we can decipher from how returns are changing.
Return On Capital Employed (ROCE): What Is It?
For those who don't know, ROCE is a measure of a company's yearly pre-tax profit (its return), relative to the capital employed in the business. To calculate this metric for Best Buy, this is the formula:
Return on Capital Employed = Earnings Before Interest and Tax (EBIT) ÷ (Total Assets - Current Liabilities)
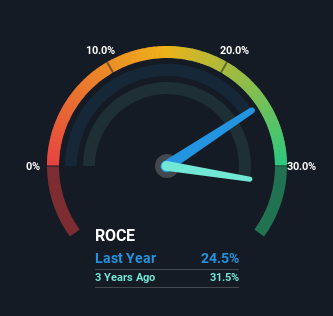
0.24 = US$1.7b ÷ (US$15b - US$7.9b) (Based on the trailing twelve months to February 2024).
Therefore, Best Buy has an ROCE of 24%. That's a fantastic return and not only that, it outpaces the average of 13% earned by companies in a similar industry.
View our latest analysis for Best Buy
Above you can see how the current ROCE for Best Buy compares to its prior returns on capital, but there's only so much you can tell from the past. If you'd like to see what analysts are forecasting going forward, you should check out our free analyst report for Best Buy .
What Can We Tell From Best Buy's ROCE Trend?
On the surface, the trend of ROCE at Best Buy doesn't inspire confidence. While it's comforting that the ROCE is high, five years ago it was 36%. Meanwhile, the business is utilizing more capital but this hasn't moved the needle much in terms of sales in the past 12 months, so this could reflect longer term investments. It's worth keeping an eye on the company's earnings from here on to see if these investments do end up contributing to the bottom line.
Another thing to note, Best Buy has a high ratio of current liabilities to total assets of 53%. This effectively means that suppliers (or short-term creditors) are funding a large portion of the business, so just be aware that this can introduce some elements of risk. While it's not necessarily a bad thing, it can be beneficial if this ratio is lower.
What We Can Learn From Best Buy's ROCE
In summary, Best Buy is reinvesting funds back into the business for growth but unfortunately it looks like sales haven't increased much just yet. And with the stock having returned a mere 30% in the last five years to shareholders, you could argue that they're aware of these lackluster trends. So if you're looking for a multi-bagger, the underlying trends indicate you may have better chances elsewhere.
On a final note, we found 3 warning signs for Best Buy (1 is a bit concerning) you should be aware of.
Best Buy is not the only stock earning high returns. If you'd like to see more, check out our free list of companies earning high returns on equity with solid fundamentals.
Valuation is complex, but we're here to simplify it.
Discover if Best Buy might be undervalued or overvalued with our detailed analysis, featuring fair value estimates, potential risks, dividends, insider trades, and its financial condition.
Access Free AnalysisHave feedback on this article? Concerned about the content? Get in touch with us directly. Alternatively, email editorial-team (at) simplywallst.com.
This article by Simply Wall St is general in nature. We provide commentary based on historical data and analyst forecasts only using an unbiased methodology and our articles are not intended to be financial advice. It does not constitute a recommendation to buy or sell any stock, and does not take account of your objectives, or your financial situation. We aim to bring you long-term focused analysis driven by fundamental data. Note that our analysis may not factor in the latest price-sensitive company announcements or qualitative material. Simply Wall St has no position in any stocks mentioned.
About NYSE:BBY
Best Buy
Offers technology products and solutions in the United States, Canada, and internationally.
6 star dividend payer and undervalued.
Similar Companies
Market Insights

Advertisement
Community Narratives
Groundbreaking therapies that could change the treatment landscape for PTSD, fibromyalgia, MS & Alzheimer’s
Fair Value US$6.20|86.9% undervalued
CM
Community Contributor
DigitalOcean Will Grow 14% by Embracing AI with Paperspace Acquisition
Fair Value US$50.00|40.2% undervalued
NE
Community Contributor
Viant Technology: A Rising AdTech Challenger in the AI-Powered CTV Market
Fair Value US$38.61|62.7% undervalued
BL
Community Contributor
Volvo will Accelerate Forward into Electric and Autonomous Leadership in Five Years
Fair Value SEK 438.80|40.1% undervalued
UN
Community Contributor