Advertisement
- United States
- /
- Specialty Stores
- /
- NasdaqGS:UPBD
Does Upbound Group’s 20% Drop Signal a Potential Opportunity in 2025?

Simply Wall St
Reviewed by Bailey Pemberton
Ever caught yourself staring at Upbound Group's stock chart and wondering if now is the time to act? You are not alone. After a tough stretch this year, with shares closing recently at $22.74 and down a hefty 20.5% since January, it's understandable to feel cautious. Even looking further back, the stock's 1-year and 5-year moves sit in negative territory, at -18.6% and -15.1% respectively. Yet, it's not all bad news. Upbound Group's longer-term track record includes a 39.8% gain over three years, proving it can hold its own when the stars align.
Much of this volatility is tied to broader market shifts and changing sentiment on consumer credit, factors that tend to move stocks in Upbound's finance-adjacent sector. Recently, subtle shifts in risk appetite and macroeconomic headlines have nudged the stock lower. Even as shares have fallen, the company's value proposition is looking surprisingly robust. Upbound currently earns a valuation score of 5 out of 6, checking virtually all the boxes analysts use to gauge if a company is undervalued.
So, how do these valuation methods really stack up, and what should investors like us be focusing on when sizing up Upbound Group? Let's break down each approach, but stay tuned. There is an even sharper way to look at the company's true worth that goes beyond the usual toolkit.
Why Upbound Group is lagging behind its peers
Approach 1: Upbound Group Discounted Cash Flow (DCF) Analysis
A Discounted Cash Flow (DCF) model is designed to estimate a company’s true worth by projecting its future cash flows and discounting those figures back to today's value. This helps investors look beyond market swings and focus on the underlying financial engine powering the business.
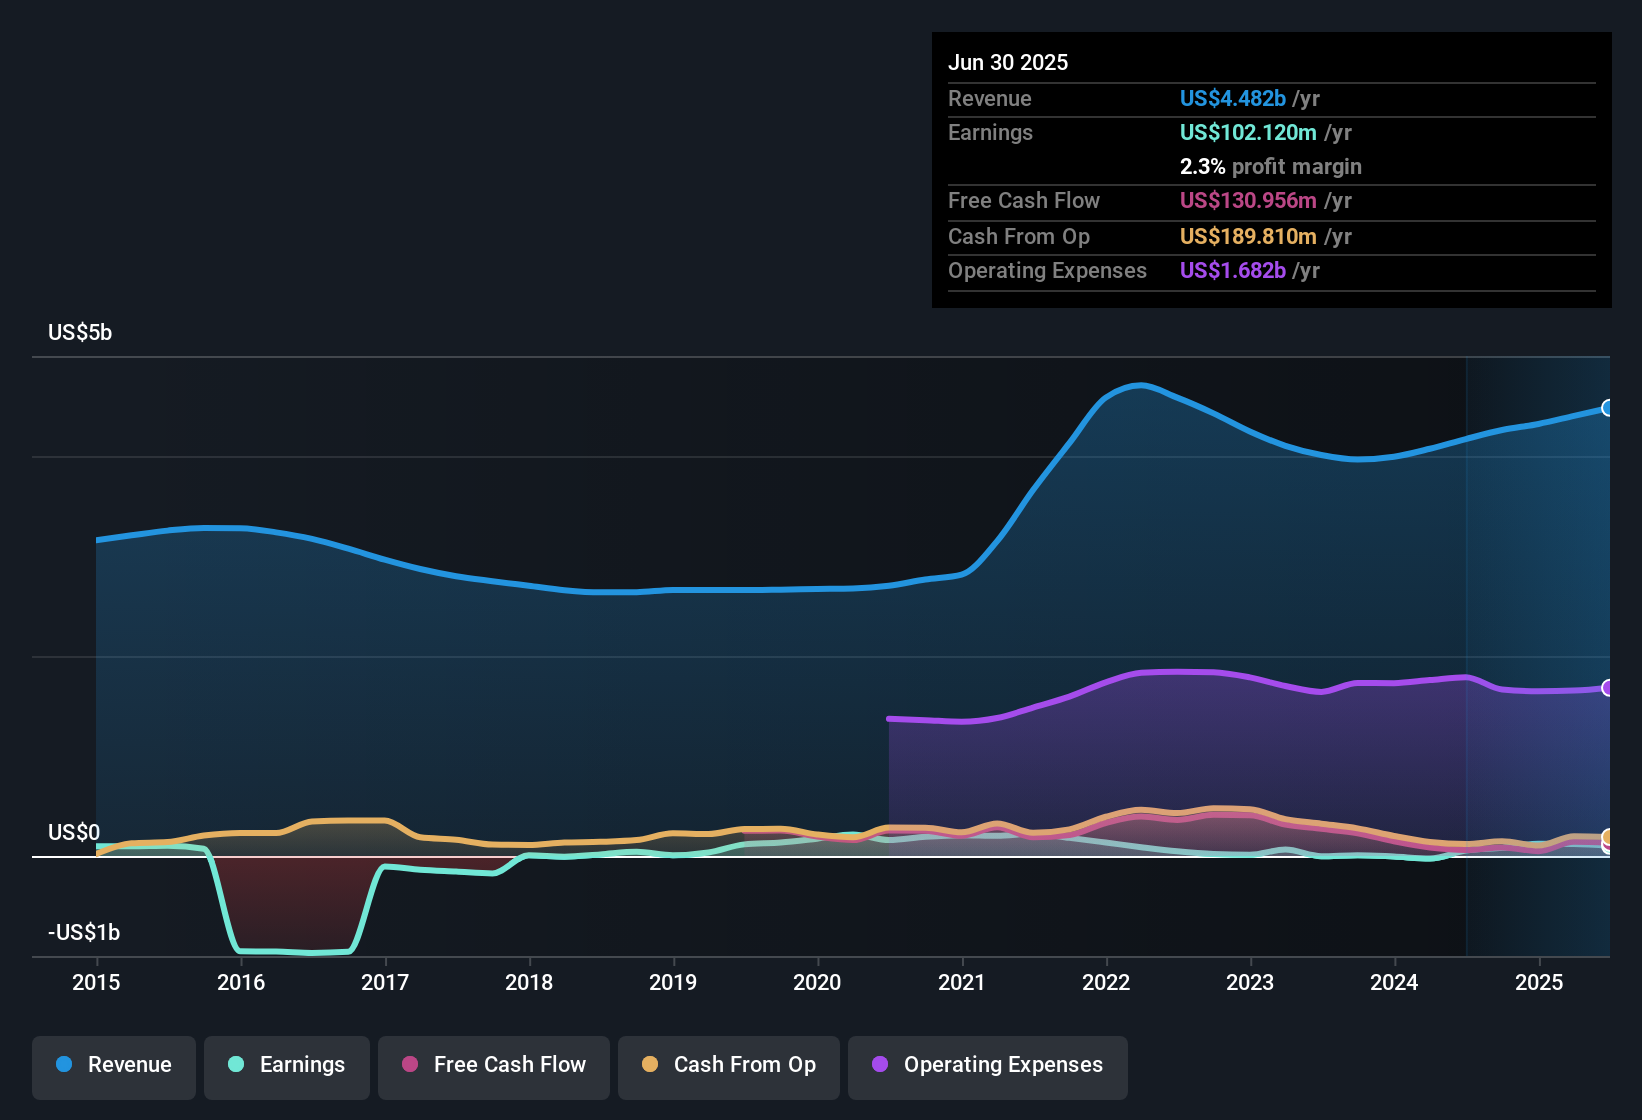
For Upbound Group, the most recent Free Cash Flow (FCF) stands at $129.99 million. Analysts expect FCF to climb to $350 million by 2029, with projections beyond five years based on conservative growth assumptions. Each year, these cash flows are discounted to account for risks and the time value of money, using a Two-Stage Free Cash Flow to Equity model. All reported figures are in US dollars.
Crunching the numbers, the model assigns an intrinsic value of $63.41 per share, which is significantly above the recent stock price of $22.74. This implies Upbound Group is trading at a steep 64.1% discount relative to its estimated fair value.
Result: UNDERVALUED
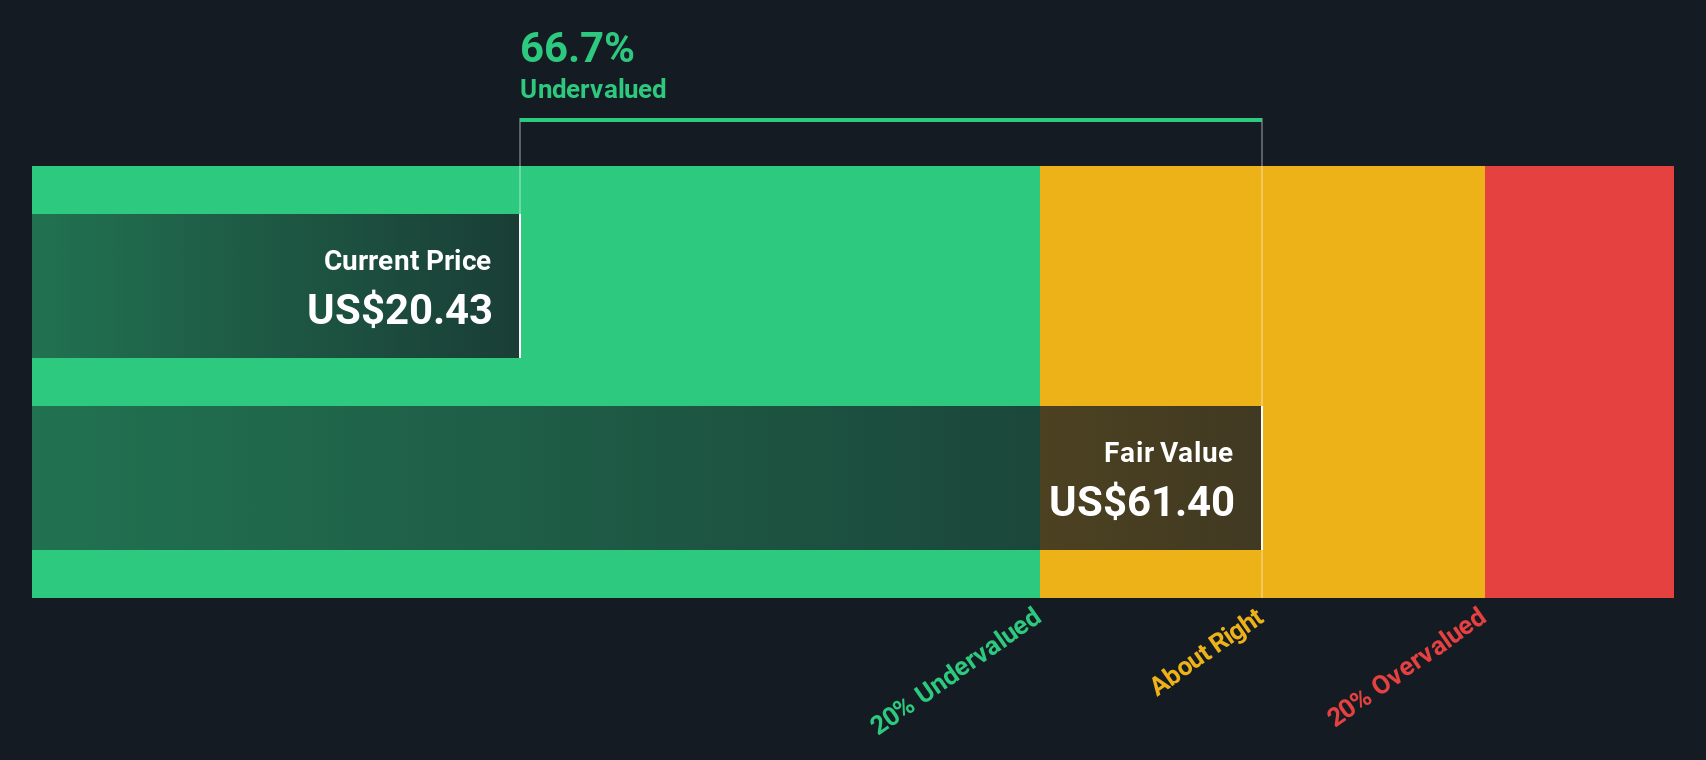
Our Discounted Cash Flow (DCF) analysis suggests Upbound Group is undervalued by 64.1%. Track this in your watchlist or portfolio, or discover more undervalued stocks.
Approach 2: Upbound Group Price vs Earnings
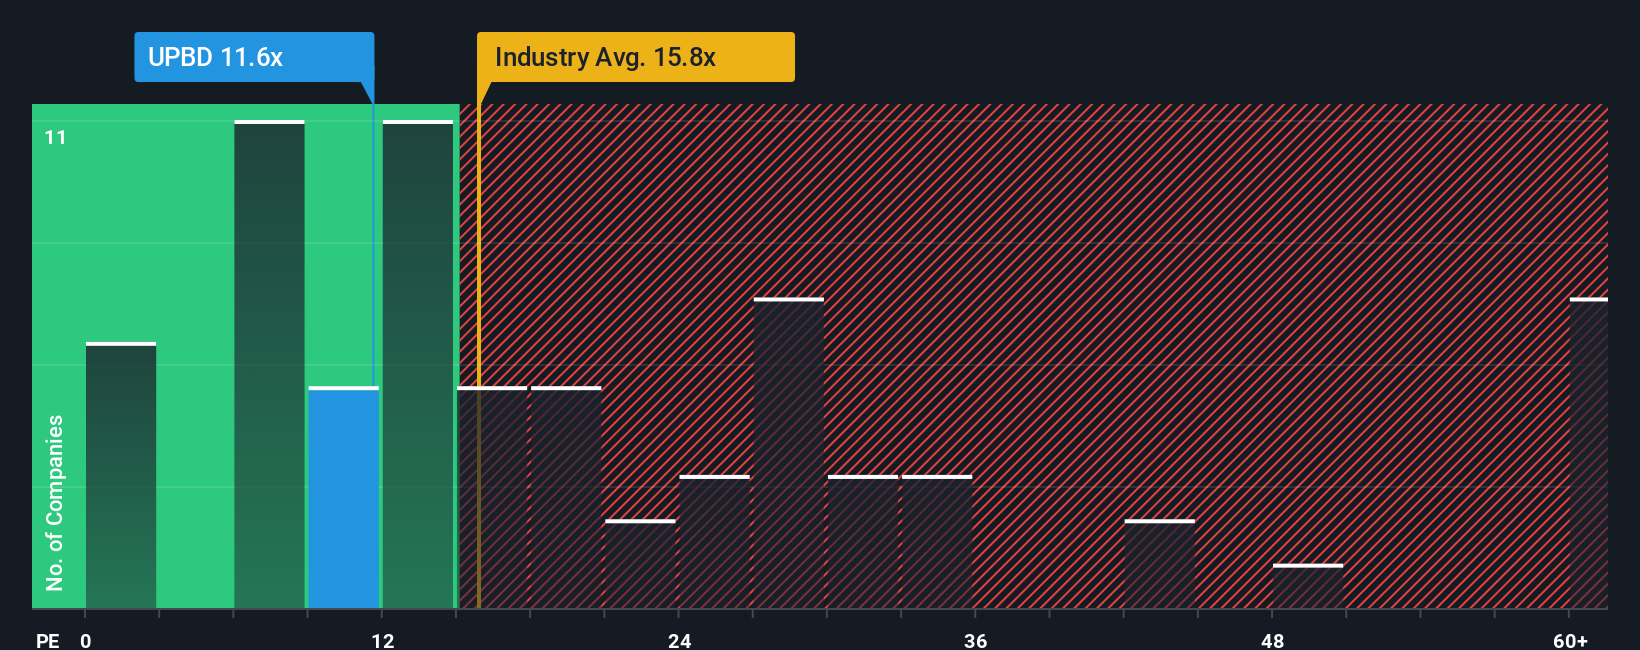
For established, profitable companies like Upbound Group, the price-to-earnings (PE) ratio is a time-tested way of measuring whether a stock is sensibly valued. The PE ratio tells us how much investors are willing to pay for each dollar of current earnings. This metric is shaped by expectations for future growth and the risks the company faces. Fast-growing or lower-risk firms tend to command higher PE multiples, while riskier or slower growers usually trade lower.
Currently, Upbound Group trades at a PE of 12.9x, which sits below both the Specialty Retail industry average of 17.3x and the peer average of 28.5x. At a glance, this could make shares look inexpensive compared to its direct competition. However, it's not always wise to compare PE ratios in isolation, since factors like growth potential and profit margins can make a big difference in what’s considered “fair.”
That’s where Simply Wall St’s Fair Ratio comes in. The Fair Ratio, here 21.0x, is tailored for Upbound Group’s unique profile, factoring in its growth outlook, industry backdrop, profitability, scale, and risk. Unlike a simple apples-to-apples comparison against an industry average, the Fair Ratio provides a fuller context for what investors should reasonably pay for the business.
With Upbound Group’s actual PE at 12.9x, well below the Fair Ratio of 21.0x, the stock appears undervalued on this basis, suggesting the market may be underestimating its earnings power and future prospects.
Result: UNDERVALUED
PE ratios tell one story, but what if the real opportunity lies elsewhere? Discover companies where insiders are betting big on explosive growth.
Upgrade Your Decision Making: Choose your Upbound Group Narrative
Earlier, we mentioned that there is an even better way to understand valuation, so let's introduce you to Narratives. A Narrative is a clear, personalized story that connects your own view on a company's future, including its likely revenue, earnings, margins, and risks, to a financial forecast and a fair value estimate. By building a Narrative on Simply Wall St’s Community page, used by millions of investors, you start with your perspective on Upbound Group’s future and see how those beliefs translate into real numbers. This approach helps you anchor decisions in more than just raw ratios or historical charts.
Narratives are powerful because they bridge the gap between what you think will happen and what the market is pricing. By comparing your Narrative’s fair value to the current share price, you can see if an opportunity or risk is emerging. Better still, Narratives are automatically updated when earnings, news, or other data change, ensuring your forecasts stay current. For example, one investor may believe Upbound Group’s earnings will surge as new products and e-commerce channels drive growth, supporting a Narrative fair value as high as $50.00. Another investor, focusing on economic risks and legal headwinds, might set their Narrative fair value at $33.00. Narratives make it simple for anyone to put their story to the test and act decisively when new information arrives.
Do you think there's more to the story for Upbound Group? Create your own Narrative to let the Community know!
This article by Simply Wall St is general in nature. We provide commentary based on historical data and analyst forecasts only using an unbiased methodology and our articles are not intended to be financial advice. It does not constitute a recommendation to buy or sell any stock, and does not take account of your objectives, or your financial situation. We aim to bring you long-term focused analysis driven by fundamental data. Note that our analysis may not factor in the latest price-sensitive company announcements or qualitative material. Simply Wall St has no position in any stocks mentioned.
New: AI Stock Screener & Alerts
Our new AI Stock Screener scans the market every day to uncover opportunities.
• Dividend Powerhouses (3%+ Yield)
• Undervalued Small Caps with Insider Buying
• High growth Tech and AI Companies
Or build your own from over 50 metrics.
Have feedback on this article? Concerned about the content? Get in touch with us directly. Alternatively, email editorial-team@simplywallst.com
About NasdaqGS:UPBD
Upbound Group
Upbound Group, Inc. leases household durable goods to customers on a lease-to-own basis in the United States, Puerto Rico, and Mexico.
Undervalued established dividend payer.
Similar Companies
Market Insights

Advertisement
Community Narratives
The Next Phase of Energy Storage: How NeoVolta Is Tackling America’s Power Crunch
Fair Value US$7.50|35.1% undervalued
MA
Community Contributor
Why EnSilica is Worth Possibly 13x its Current Price
Fair Value UK£5.00|89.8% undervalued
DO
Community Contributor
M&A Activity, Industry Diversification & A Defense Contract Monopoly Will Push BWXT For Healthy Long-Term Growth
Fair Value US$220.00|15.2% undervalued
CL
Community Contributor
A case for Cassiar Gold Corp (TSXV: GLDC) to reach CAD$8-10 before 2030 (X30-37)
Fair Value CA$10.00|96.0% undervalued
AG
Community Contributor