
Advertisement
- United States
- /
- Specialty Stores
- /
- NasdaqGS:LESL
With A 26% Price Drop For Leslie's, Inc. (NASDAQ:LESL) You'll Still Get What You Pay For

Leslie's, Inc. (NASDAQ:LESL) shareholders won't be pleased to see that the share price has had a very rough month, dropping 26% and undoing the prior period's positive performance. Instead of being rewarded, shareholders who have already held through the last twelve months are now sitting on a 46% share price drop.
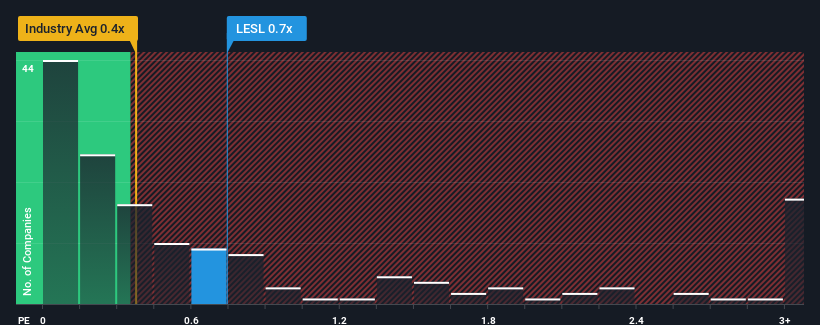
Although its price has dipped substantially, you could still be forgiven for feeling indifferent about Leslie's' P/S ratio of 0.7x, since the median price-to-sales (or "P/S") ratio for the Specialty Retail industry in the United States is also close to 0.4x. However, investors might be overlooking a clear opportunity or potential setback if there is no rational basis for the P/S.
See our latest analysis for Leslie's
What Does Leslie's' Recent Performance Look Like?
Leslie's could be doing better as its revenue has been going backwards lately while most other companies have been seeing positive revenue growth. One possibility is that the P/S ratio is moderate because investors think this poor revenue performance will turn around. However, if this isn't the case, investors might get caught out paying too much for the stock.
Keen to find out how analysts think Leslie's' future stacks up against the industry? In that case, our free report is a great place to start.Do Revenue Forecasts Match The P/S Ratio?
The only time you'd be comfortable seeing a P/S like Leslie's' is when the company's growth is tracking the industry closely.
Retrospectively, the last year delivered a frustrating 9.0% decrease to the company's top line. Regardless, revenue has managed to lift by a handy 26% in aggregate from three years ago, thanks to the earlier period of growth. So we can start by confirming that the company has generally done a good job of growing revenue over that time, even though it had some hiccups along the way.
Turning to the outlook, the next year should generate growth of 1.9% as estimated by the analysts watching the company. With the industry predicted to deliver 3.8% growth , the company is positioned for a comparable revenue result.
In light of this, it's understandable that Leslie's' P/S sits in line with the majority of other companies. It seems most investors are expecting to see average future growth and are only willing to pay a moderate amount for the stock.
The Key Takeaway
Leslie's' plummeting stock price has brought its P/S back to a similar region as the rest of the industry. Typically, we'd caution against reading too much into price-to-sales ratios when settling on investment decisions, though it can reveal plenty about what other market participants think about the company.
Our look at Leslie's' revenue growth estimates show that its P/S is about what we expect, as both metrics follow closely with the industry averages. Right now shareholders are comfortable with the P/S as they are quite confident future revenue won't throw up any surprises. Unless these conditions change, they will continue to support the share price at these levels.
You need to take note of risks, for example - Leslie's has 5 warning signs (and 2 which are a bit unpleasant) we think you should know about.
It's important to make sure you look for a great company, not just the first idea you come across. So if growing profitability aligns with your idea of a great company, take a peek at this free list of interesting companies with strong recent earnings growth (and a low P/E).
New: AI Stock Screener & Alerts
Our new AI Stock Screener scans the market every day to uncover opportunities.
• Dividend Powerhouses (3%+ Yield)
• Undervalued Small Caps with Insider Buying
• High growth Tech and AI Companies
Or build your own from over 50 metrics.
Have feedback on this article? Concerned about the content? Get in touch with us directly. Alternatively, email editorial-team (at) simplywallst.com.
This article by Simply Wall St is general in nature. We provide commentary based on historical data and analyst forecasts only using an unbiased methodology and our articles are not intended to be financial advice. It does not constitute a recommendation to buy or sell any stock, and does not take account of your objectives, or your financial situation. We aim to bring you long-term focused analysis driven by fundamental data. Note that our analysis may not factor in the latest price-sensitive company announcements or qualitative material. Simply Wall St has no position in any stocks mentioned.
About NasdaqGS:LESL
Leslie's
Operates as a direct-to-consumer pool and spa care brand in the United States.
Good value with moderate growth potential.
Similar Companies
Market Insights

Advertisement
Community Narratives
Groundbreaking therapies that could change the treatment landscape for PTSD, fibromyalgia, MS & Alzheimer’s
Fair Value US$6.20|86.8% undervalued
CM
Community Contributor
DigitalOcean Will Grow 14% by Embracing AI with Paperspace Acquisition
Fair Value US$50.00|42.8% undervalued
NE
Community Contributor
Viant Technology: A Rising AdTech Challenger in the AI-Powered CTV Market
Fair Value US$38.61|61.4% undervalued
BL
Community Contributor
Volvo will Accelerate Forward into Electric and Autonomous Leadership in Five Years
Fair Value SEK 438.80|40.8% undervalued
UN
Community Contributor