- United States
- /
- Specialty Stores
- /
- NasdaqCM:GRWG
GrowGeneration Corp.'s (NASDAQ:GRWG) Intrinsic Value Is Potentially 30% Above Its Share Price

Key Insights
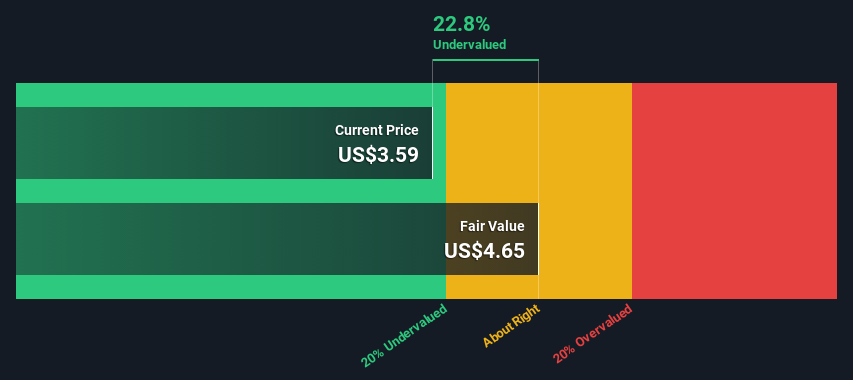
- The projected fair value for GrowGeneration is US$4.65 based on 2 Stage Free Cash Flow to Equity
- Current share price of US$3.59 suggests GrowGeneration is potentially 23% undervalued
- Analyst price target for GRWG is US$5.26, which is 13% above our fair value estimate
How far off is GrowGeneration Corp. (NASDAQ:GRWG) from its intrinsic value? Using the most recent financial data, we'll take a look at whether the stock is fairly priced by projecting its future cash flows and then discounting them to today's value. The Discounted Cash Flow (DCF) model is the tool we will apply to do this. Don't get put off by the jargon, the math behind it is actually quite straightforward.
We would caution that there are many ways of valuing a company and, like the DCF, each technique has advantages and disadvantages in certain scenarios. For those who are keen learners of equity analysis, the Simply Wall St analysis model here may be something of interest to you.
See our latest analysis for GrowGeneration
The Model
We use what is known as a 2-stage model, which simply means we have two different periods of growth rates for the company's cash flows. Generally the first stage is higher growth, and the second stage is a lower growth phase. To start off with, we need to estimate the next ten years of cash flows. Where possible we use analyst estimates, but when these aren't available we extrapolate the previous free cash flow (FCF) from the last estimate or reported value. We assume companies with shrinking free cash flow will slow their rate of shrinkage, and that companies with growing free cash flow will see their growth rate slow, over this period. We do this to reflect that growth tends to slow more in the early years than it does in later years.
A DCF is all about the idea that a dollar in the future is less valuable than a dollar today, so we discount the value of these future cash flows to their estimated value in today's dollars:
10-year free cash flow (FCF) estimate
| 2024 | 2025 | 2026 | 2027 | 2028 | 2029 | 2030 | 2031 | 2032 | 2033 | |
| Levered FCF ($, Millions) | US$4.50m | US$7.23m | US$10.3m | US$13.5m | US$16.5m | US$19.2m | US$21.5m | US$23.4m | US$25.0m | US$26.4m |
| Growth Rate Estimate Source | Analyst x1 | Est @ 60.62% | Est @ 43.06% | Est @ 30.78% | Est @ 22.18% | Est @ 16.16% | Est @ 11.94% | Est @ 8.99% | Est @ 6.93% | Est @ 5.48% |
| Present Value ($, Millions) Discounted @ 8.5% | US$4.1 | US$6.1 | US$8.1 | US$9.7 | US$11.0 | US$11.7 | US$12.1 | US$12.2 | US$12.0 | US$11.6 |
("Est" = FCF growth rate estimated by Simply Wall St)
Present Value of 10-year Cash Flow (PVCF) = US$99m
The second stage is also known as Terminal Value, this is the business's cash flow after the first stage. For a number of reasons a very conservative growth rate is used that cannot exceed that of a country's GDP growth. In this case we have used the 5-year average of the 10-year government bond yield (2.1%) to estimate future growth. In the same way as with the 10-year 'growth' period, we discount future cash flows to today's value, using a cost of equity of 8.5%.
Terminal Value (TV)= FCF2033 × (1 + g) ÷ (r – g) = US$26m× (1 + 2.1%) ÷ (8.5%– 2.1%) = US$420m
Present Value of Terminal Value (PVTV)= TV / (1 + r)10= US$420m÷ ( 1 + 8.5%)10= US$185m
The total value is the sum of cash flows for the next ten years plus the discounted terminal value, which results in the Total Equity Value, which in this case is US$284m. In the final step we divide the equity value by the number of shares outstanding. Compared to the current share price of US$3.6, the company appears a touch undervalued at a 23% discount to where the stock price trades currently. The assumptions in any calculation have a big impact on the valuation, so it is better to view this as a rough estimate, not precise down to the last cent.
The Assumptions
Now the most important inputs to a discounted cash flow are the discount rate, and of course, the actual cash flows. Part of investing is coming up with your own evaluation of a company's future performance, so try the calculation yourself and check your own assumptions. The DCF also does not consider the possible cyclicality of an industry, or a company's future capital requirements, so it does not give a full picture of a company's potential performance. Given that we are looking at GrowGeneration as potential shareholders, the cost of equity is used as the discount rate, rather than the cost of capital (or weighted average cost of capital, WACC) which accounts for debt. In this calculation we've used 8.5%, which is based on a levered beta of 1.081. Beta is a measure of a stock's volatility, compared to the market as a whole. We get our beta from the industry average beta of globally comparable companies, with an imposed limit between 0.8 and 2.0, which is a reasonable range for a stable business.
SWOT Analysis for GrowGeneration
- Debt is not viewed as a risk.
- No major weaknesses identified for GRWG.
- Forecast to reduce losses next year.
- Has sufficient cash runway for more than 3 years based on current free cash flows.
- Trading below our estimate of fair value by more than 20%.
- Not expected to become profitable over the next 3 years.
Next Steps:
Valuation is only one side of the coin in terms of building your investment thesis, and it shouldn't be the only metric you look at when researching a company. The DCF model is not a perfect stock valuation tool. Instead the best use for a DCF model is to test certain assumptions and theories to see if they would lead to the company being undervalued or overvalued. For example, changes in the company's cost of equity or the risk free rate can significantly impact the valuation. Why is the intrinsic value higher than the current share price? For GrowGeneration, we've compiled three essential factors you should assess:
- Risks: For example, we've discovered 2 warning signs for GrowGeneration that you should be aware of before investing here.
- Future Earnings: How does GRWG's growth rate compare to its peers and the wider market? Dig deeper into the analyst consensus number for the upcoming years by interacting with our free analyst growth expectation chart.
- Other Solid Businesses: Low debt, high returns on equity and good past performance are fundamental to a strong business. Why not explore our interactive list of stocks with solid business fundamentals to see if there are other companies you may not have considered!
PS. Simply Wall St updates its DCF calculation for every American stock every day, so if you want to find the intrinsic value of any other stock just search here.
New: Manage All Your Stock Portfolios in One Place
We've created the ultimate portfolio companion for stock investors, and it's free.
• Connect an unlimited number of Portfolios and see your total in one currency
• Be alerted to new Warning Signs or Risks via email or mobile
• Track the Fair Value of your stocks
Have feedback on this article? Concerned about the content? Get in touch with us directly. Alternatively, email editorial-team (at) simplywallst.com.
This article by Simply Wall St is general in nature. We provide commentary based on historical data and analyst forecasts only using an unbiased methodology and our articles are not intended to be financial advice. It does not constitute a recommendation to buy or sell any stock, and does not take account of your objectives, or your financial situation. We aim to bring you long-term focused analysis driven by fundamental data. Note that our analysis may not factor in the latest price-sensitive company announcements or qualitative material. Simply Wall St has no position in any stocks mentioned.
About NasdaqCM:GRWG
GrowGeneration
Through its subsidiaries, owns and operates retail hydroponic and organic gardening stores in the United States.
Flawless balance sheet very low.
Similar Companies
Market Insights

Community Narratives

