Advertisement
- United States
- /
- General Merchandise and Department Stores
- /
- NasdaqGS:AMZN
Assessing Amazon’s True Value After Strong 5.2% Weekly Share Price Jump

Simply Wall St
Reviewed by Bailey Pemberton
Trying to decide what to do with your Amazon.com stock? You’re not alone. Whether you're a seasoned shareholder or just watching from the sidelines, you’ve probably noticed that Amazon’s price keeps moving, fueled by a constant stream of headlines and investor opinions. In the past week alone, Amazon shares have jumped 5.2%, outpacing the broader market, and recording a 19.4% gain over the past year. Even after such strong performance, questions about the company’s true value remain at the forefront for investors.
Recent news highlighting Amazon’s continued expansion into artificial intelligence and logistics has sparked fresh optimism about growth prospects. At the same time, ongoing debates about regulatory risks and fierce retail competition have kept some traders wary. All of this has led to noticeable shifts in risk perception, which are reflected in both short-term and long-term price swings. For instance, Amazon’s stock has more than doubled over the last three years, representing a 116.8% return, which demonstrates just how quickly opinions on its future can change.
When it comes to valuation, the scorecard shows Amazon is undervalued by three out of six major checks, giving it a value score of 3 out of 6 and suggesting there is more to consider beneath the surface. In the next section, we will break down exactly how those valuation methods stack up for Amazon and why a smarter, more nuanced way to assess its stock might make all the difference for investors trying to make the right move.
Why Amazon.com is lagging behind its peers
Approach 1: Amazon.com Discounted Cash Flow (DCF) Analysis
The Discounted Cash Flow (DCF) model estimates a company's true value by projecting its future cash flows and then calculating what those cash flows are worth today. This approach offers a forward-looking perspective by focusing on how much money the business is expected to actually generate, rather than just recent profits or sales.
For Amazon.com, the current Free Cash Flow stands at $37.6 billion. According to available analyst projections, Amazon's free cash flow is expected to surpass $134.7 billion by 2029. Beyond the first five years, future cash flow estimates are extrapolated and reveal a steady annual increase through 2035. All values are considered in US dollars.
Based on these projections, the DCF model calculates an intrinsic value of $272.98 per share. Compared to the current market price, this suggests the stock is trading at a 17.9% discount. This means it could be significantly undervalued according to this model.
Result: UNDERVALUED
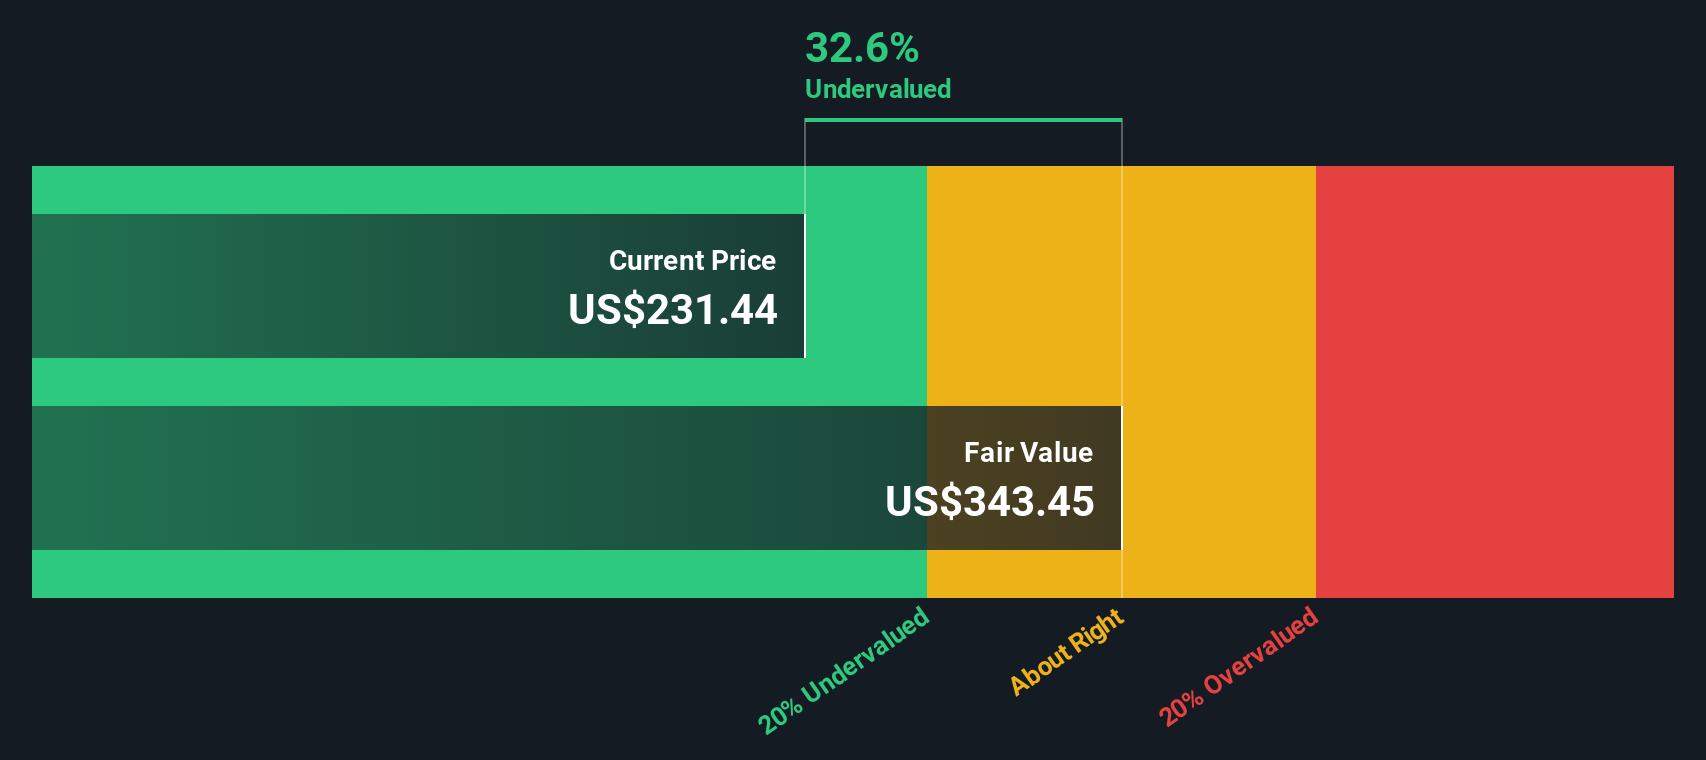
Our Discounted Cash Flow (DCF) analysis suggests Amazon.com is undervalued by 17.9%. Track this in your watchlist or portfolio, or discover more undervalued stocks.
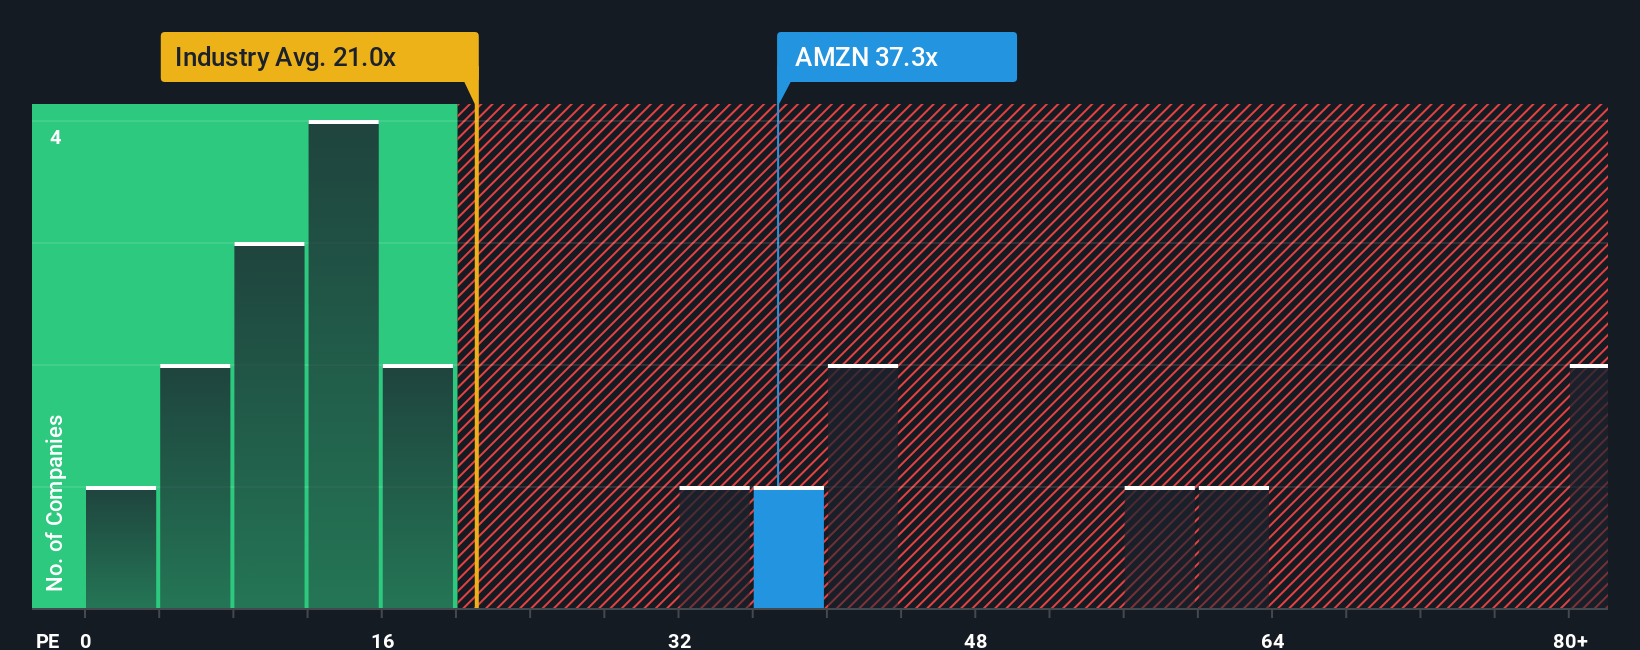
Approach 2: Amazon.com Price vs Earnings (PE)
For established, profitable businesses like Amazon.com, the Price-to-Earnings (PE) ratio is a widely used valuation metric because it measures how much investors are willing to pay today for a dollar of future earnings. It is a quick barometer for how a stock stacks up on value compared to its profits, making it especially insightful for companies consistently generating positive earnings.
However, interpreting the PE ratio is not just about the number in isolation. Growth expectations and risk play a major role in what is considered a “normal” or “fair” PE ratio. Companies with higher expected earnings growth or stronger competitive positions typically command higher PE multiples, while greater risks or slower growth lead to lower multiples.
Amazon’s current PE ratio sits at 33.86x, which is notably higher than the Multiline Retail industry average of 21.33x and a bit below the peer group average of 40.64x. Rather than simply comparing these benchmarks, Simply Wall St’s proprietary “Fair Ratio” methodology goes deeper. This approach considers not just market comparables but also Amazon’s expected growth, profit margin, business risks, industry context and market capitalization to determine a tailored benchmark. For Amazon, the Fair Ratio is 38.98x. This is slightly above the company’s current PE, indicating that the stock’s price is, in fact, about right given its specific fundamentals.
Result: ABOUT RIGHT
PE ratios tell one story, but what if the real opportunity lies elsewhere? Discover companies where insiders are betting big on explosive growth.
Upgrade Your Decision Making: Choose your Amazon.com Narrative
Earlier we mentioned that there is an even better way to understand valuation. Let's introduce you to Narratives, a smarter and more dynamic approach available on Simply Wall St’s Community page that empowers millions of investors.
A Narrative is your personal story and expectations for a company. Think of it as connecting the company’s business realities, your assumptions about future revenue, earnings, and margins, and your own “fair value.” All of this comes together in one place and is backed by live financial data.
This means you can go beyond traditional ratios and models by building an investment view that matches your knowledge and beliefs. You can then see exactly how the latest company news or earnings updates affect your thesis and valuation in real time.
Narratives also simplify tough decisions. When your Fair Value (based on your Narrative) is above today’s price, you might consider buying, and when it’s below, you might reconsider. Your view stays current as new information arrives.
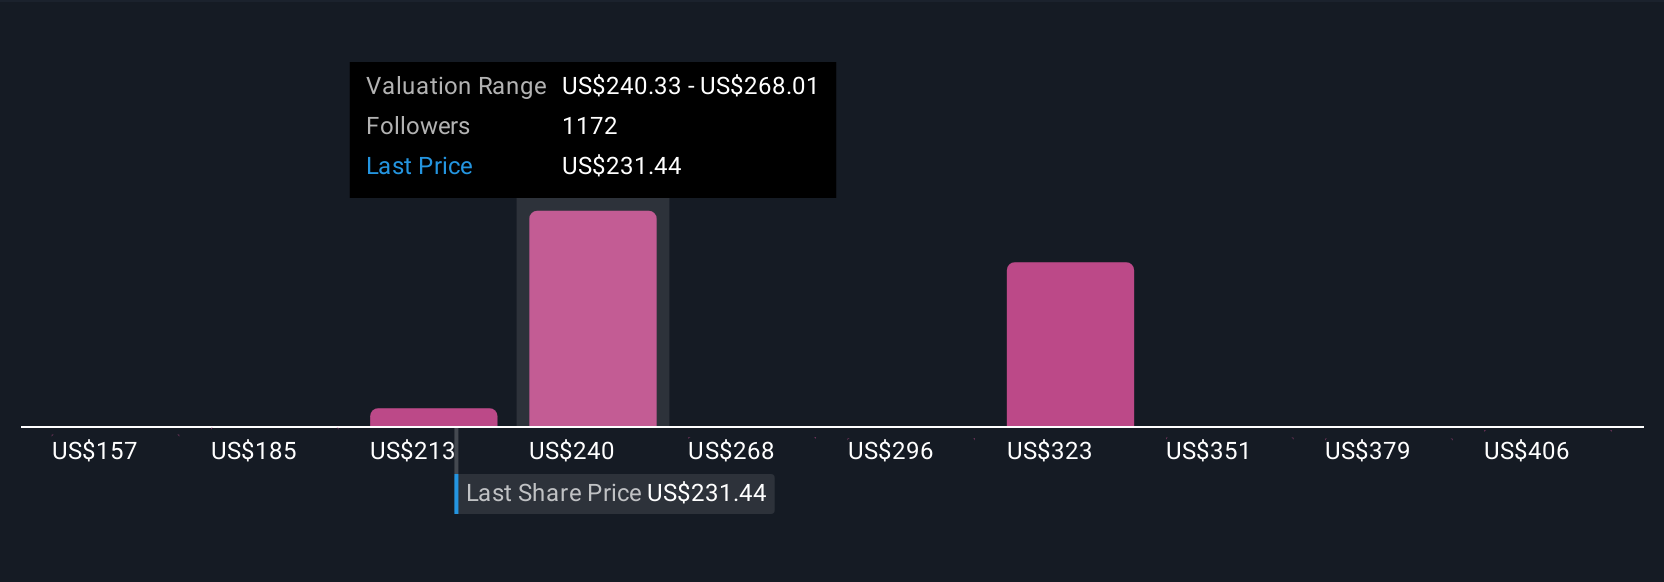
For example, some investors believe Amazon will deliver transformative profit expansion in its high-growth, high-margin cloud and advertising businesses, supporting a fair value of over $266 per share. Others focus on more moderate retail growth and see fair value closer to $151. Narratives make these views transparent, comparable, and actionable at a glance.
For Amazon.com, we'll make it really easy for you with previews of two leading Amazon.com Narratives:
Fair Value (Bull Case): $234.75
Undervalued by 4.45% vs last close
Revenue Growth Outlook: 13.6%
- Bullish on Amazon's long-term prospects due to its dominant e-commerce platform, AWS leadership, and continued investments in AI and logistics.
- Sees upside from new business initiatives, high-profile partnerships, and robust revenue and earnings growth, despite near-term headwinds in AWS and competitive cloud pressures.
- Projects 2- to 10-year price targets significantly above current levels, with targets as high as $674.07 in the upside scenario. This is supported by a consistent growth strategy and innovative product pipeline.
Fair Value (Bear Case): $222.55
Overvalued by 0.75% vs last close
Revenue Growth Outlook: 15.19%
- Highlights that near-term cash flows are likely to remain suppressed as Amazon prioritizes aggressive reinvestment over immediate profitability.
- Considers ongoing reinvestment in fulfillment, new business lines, and international expansion as positives for long-term positioning. However, it emphasizes that the current share price already reflects much of this upside.
- Points to regulatory and recession risks as potential headwinds, with a fair value close to the current share price and growth moderating across key business segments such as AWS and Advertising.
Do you think there's more to the story for Amazon.com? Create your own Narrative to let the Community know!
This article by Simply Wall St is general in nature. We provide commentary based on historical data and analyst forecasts only using an unbiased methodology and our articles are not intended to be financial advice. It does not constitute a recommendation to buy or sell any stock, and does not take account of your objectives, or your financial situation. We aim to bring you long-term focused analysis driven by fundamental data. Note that our analysis may not factor in the latest price-sensitive company announcements or qualitative material. Simply Wall St has no position in any stocks mentioned.
New: Manage All Your Stock Portfolios in One Place
We've created the ultimate portfolio companion for stock investors, and it's free.
• Connect an unlimited number of Portfolios and see your total in one currency
• Be alerted to new Warning Signs or Risks via email or mobile
• Track the Fair Value of your stocks
Have feedback on this article? Concerned about the content? Get in touch with us directly. Alternatively, email editorial-team@simplywallst.com
About NasdaqGS:AMZN
Amazon.com
Engages in the retail sale of consumer products, advertising, and subscriptions service through online and physical stores in North America and internationally.
Flawless balance sheet with solid track record.
Similar Companies
Market Insights

Advertisement
Community Narratives
Finding The True Value Of A Logistics Powerhouse
Fair Value US$95.21|8.4% undervalued
NV
Community Contributor
Paradigm Biopharmaceuticals Will Lead Osteoarthritis Treatment with Zilosul's FDA Success
Fair Value AU$5.50|92.1% undervalued
AM
Community Contributor
Barrick Mining (ABX:CA): A Gold Hedge against a U.S. Shutdown
Fair Value CA$60.00|24.2% undervalued
GM
Community Contributor