RLJ Lodging Trust (RLJ) shares have continued a downward drift this month, tracking a roughly 8% slide over the past month and a larger 19% drop in the past year. Investors are watching closely to see if the stock will find support at these levels.
RLJ Lodging Trust’s 19% one-year total shareholder return is underwhelming, hinting that momentum has faded in the hospitality real estate sector. This comes despite recent market optimism elsewhere. Share price softness suggests investors remain cautious about the company’s recovery potential and risk outlook, even as valuations adjust.
With RLJ’s share price now trading more than 25% below analyst targets and an even steeper 50% discount to some intrinsic valuations, investors may wonder whether the market is overlooking potential upside or if future challenges are already reflected in the current price.
Advertisement
Price-to-Earnings of 33.3x: Is it justified?
RLJ Lodging Trust is currently trading with a steep price-to-earnings ratio of 33.3x, placing its shares at a notable premium compared to peers and its own recent performance. The last closing price was $7.05, which stands in sharp contrast to typical industry valuations.
The price-to-earnings multiple, or PE ratio, measures how much investors are willing to pay for each dollar of company earnings. For real estate investment trusts like RLJ, this gauge often reflects expectations of stable or growing profits, as it aligns price with net income performance.
However, in RLJ’s case, the current PE of 33.3x is significantly higher than both the Global Hotel and Resort REITs industry average of 17.4x and the peer average of 25.7x. When comparing this figure to the estimated fair PE of 15.1x, RLJ’s shares appear even more expensive on an earnings valuation basis. This may point to market optimism or potential mispricing that could change as fundamentals evolve.
Another View: Discounted Cash Flow Analysis Tells a Different Story
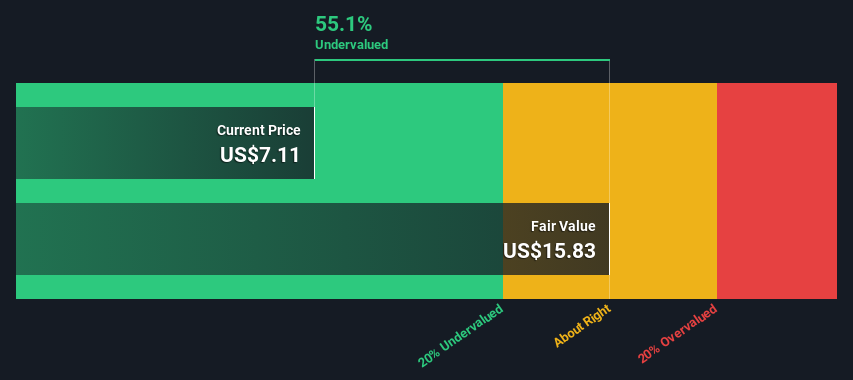
While the current price-to-earnings ratio makes RLJ Lodging Trust appear overvalued, our DCF model provides a starkly different perspective. According to this valuation, the shares are actually trading at a steep 52.6% discount to estimated fair value. Does Wall Street see hidden risks, or is the market too skeptical about RLJ's recovery prospects?
If you see things differently or would rather dig into the numbers on your own, you can craft a personalized view of RLJ Lodging Trust in just a few minutes, Do it your way
A great starting point for your RLJ Lodging Trust research is our analysis highlighting 1 key reward and 3 important warning signs that could impact your investment decision.
Looking for more investment ideas?
Take your next step with confidence and get ahead of the market by finding fresh opportunities perfectly matched to your goals using our powerful screener.
Capitalize on the rise of smarter healthcare by searching these 31 healthcare AI stocks, where artificial intelligence is driving transformative change for patients and providers.
This article by Simply Wall St is general in nature. We provide commentary based on historical data
and analyst forecasts only using an unbiased methodology and our articles are not intended to be financial advice. It does not constitute a recommendation to buy or sell any stock, and does not take account of your objectives, or your
financial situation. We aim to bring you long-term focused analysis driven by fundamental data.
Note that our analysis may not factor in the latest price-sensitive company announcements or qualitative material.
Simply Wall St has no position in any stocks mentioned.
New: AI Stock Screener & Alerts
Our new AI Stock Screener scans the market every day to uncover opportunities.
• Dividend Powerhouses (3%+ Yield) • Undervalued Small Caps with Insider Buying • High growth Tech and AI Companies
RLJ Lodging Trust ("RLJ") is a self-advised, publicly traded real estate investment trust that owns 94 premium-branded, rooms-oriented, high-margin, urban-centric hotels located within the heart of demand locations.