Realty Income (O) has seen its shares move slightly in recent sessions, with investors keeping a close eye on overall real estate market trends. The stock’s steady year-to-date return and recent performance invite a fresh look at its valuation.
Realty Income’s share price ticked up modestly to $56.80 after a run of mild intraday swings, echoing a broader pause across real estate stocks. Momentum has been steady, with the year-to-date share price return sitting close to 8%. Its one-year total shareholder return of just over 6% illustrates a consistent, if unspectacular, performance over both short and long stretches.
That leaves investors with a key question: Is Realty Income’s recent stability masking a potential undervaluation, or has the market already priced in all of the company’s future growth prospects?
Advertisement
Most Popular Narrative: 7.3% Undervalued
According to andre_santos, the latest fair value estimate for Realty Income is $61.26, just above the recent close at $56.80. The market seems to be leaving some room for upside, especially as dividend growth paces cool down.
Fair Value (Historical Dividend Yield): $66.20 💰 Dividend Discount Model: Stable Growth (Weight: 60%) We apply the Gordon Growth Model, assuming: • Dividend growth rate (g): 3.25% (assuming a rate a little below its 10 year average growth of ~3.5%) • Next year’s dividend (D1): $3.333 (current dividend of $3.228 grown by 3.25%) • Required return (r): 9% (15% margin of safety minus the dividend yield of ~6%) P = 3.333 / (0.09 - 0.0325) = 57.97 Fair Value (DDM: Stable Growth): $57.97 Valuation Summary Given the expectation that Realty Income’s dividend growth will decelerate in the coming years, greater weight will be assigned to the Dividend Discount Model. This model reflects more appropriately the anticipated slowdown in dividend growth. In contrast, the Historical Yield method assumes mean reversion, which introduces a higher degree of uncertainty, and so it will have a lower weight on the valuation.
Want a look behind the curtain? This fair value is built on some bold assumptions about payout growth, risk premiums, and future yield trends. Only by digging in can you see which ingredient really tips the scale.
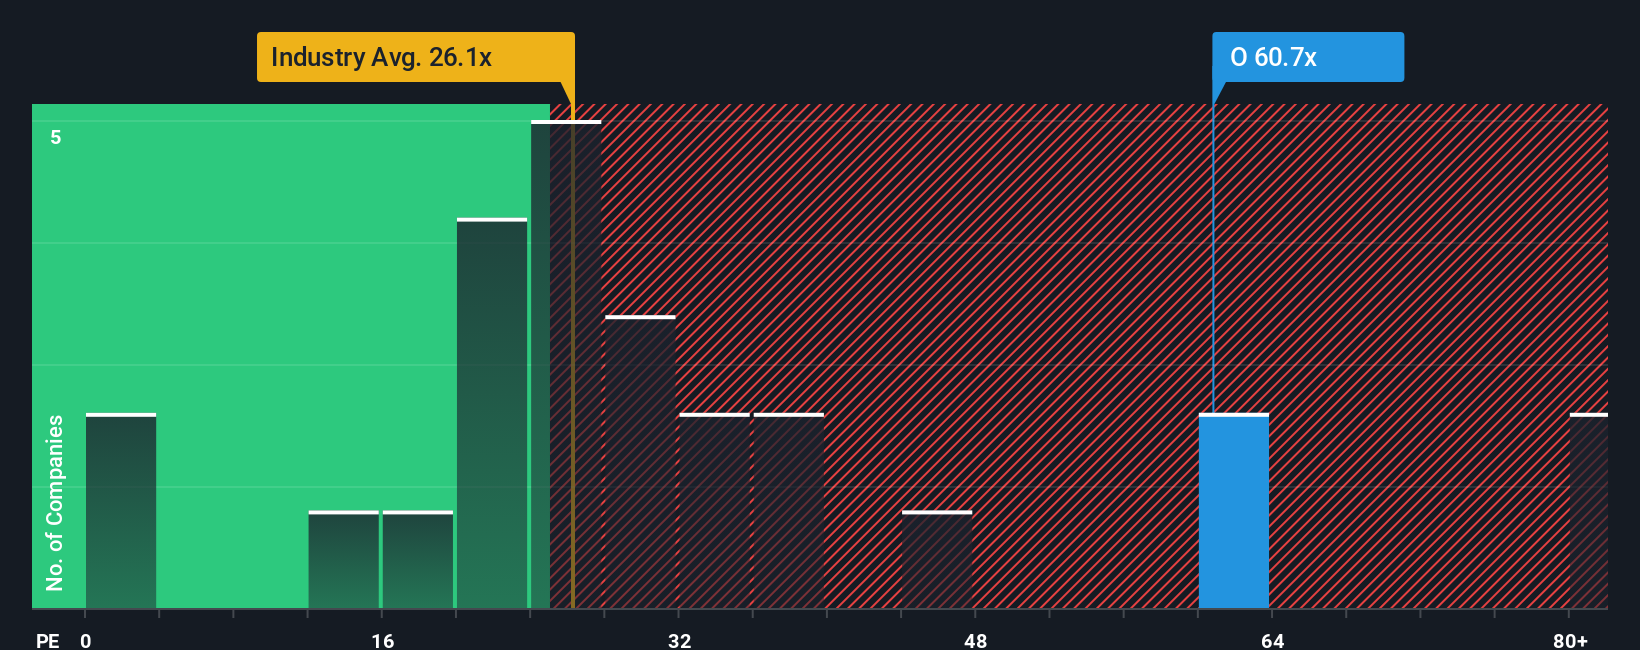
Looking at Realty Income through its price-to-earnings ratio, things change. The company trades at 54.3 times earnings, which is higher than the US Retail REITs industry average of 26.5 times and above the peer group average of 32.2. Even compared to the fair ratio of 37.5, the current price looks stretched. This premium suggests investors may be taking on added valuation risk if growth expectations are merely steady. Could the market be overlooking something, or is caution warranted here?
If these views do not match your own or you prefer to dive into the numbers yourself, you can craft a personalized narrative in just a few minutes with Do it your way
Smart investing means always staying curious. Give yourself the edge by checking out other handpicked opportunities that you might not have considered yet.
This article by Simply Wall St is general in nature. We provide commentary based on historical data
and analyst forecasts only using an unbiased methodology and our articles are not intended to be financial advice. It does not constitute a recommendation to buy or sell any stock, and does not take account of your objectives, or your
financial situation. We aim to bring you long-term focused analysis driven by fundamental data.
Note that our analysis may not factor in the latest price-sensitive company announcements or qualitative material.
Simply Wall St has no position in any stocks mentioned.
New: AI Stock Screener & Alerts
Our new AI Stock Screener scans the market every day to uncover opportunities.
• Dividend Powerhouses (3%+ Yield) • Undervalued Small Caps with Insider Buying • High growth Tech and AI Companies