
Advertisement
- United States
- /
- Office REITs
- /
- NasdaqGS:OPI
How Should You Analyze REIT Stock Office Properties Income Trust (NASDAQ:OPI)?

Office Properties Income Trust is a US$1.2b small-cap, real estate investment trust (REIT) based in Newton, United States. REITs own and operate income-generating property and adhere to a different set of regulations. This impacts how OPI’s business operates and also how we should analyse its stock. Below, I'll look at a few important metrics to keep in mind as part of your research on OPI.
Want to participate in a short research study? Help shape the future of investing tools and you could win a $250 gift card!
Check out our latest analysis for Office Properties Income Trust
Funds from Operations (FFO) is a higher quality measure of OPI's earnings compared to net income. This term is very common in the REIT investing world as it provides a cleaner look at its cash flow from daily operations by excluding impact of one-off activities or non-cash items such as depreciation. For OPI, its FFO of US$130m makes up 37% of its gross profit, which means over a third of its earnings are high-quality and recurring.
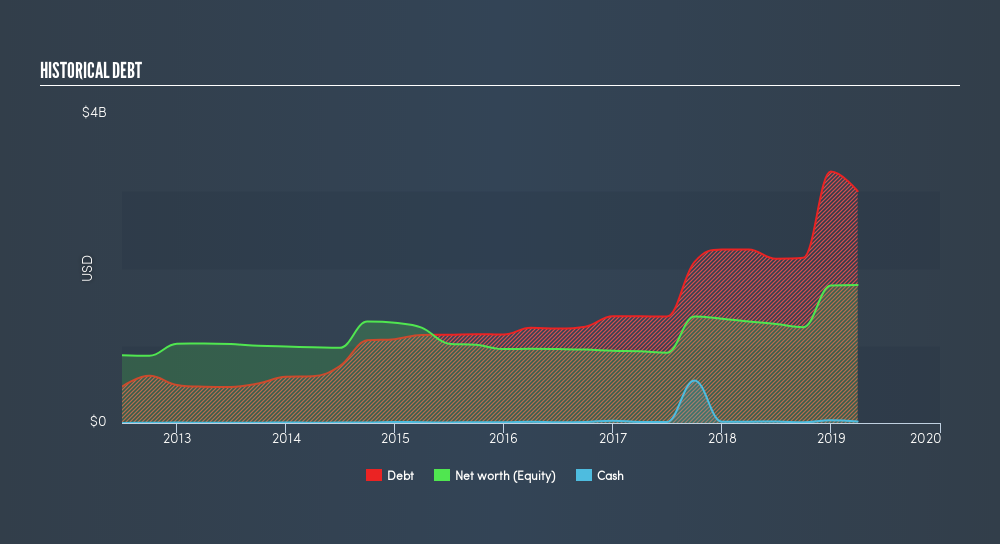
In order to understand whether OPI has a healthy balance sheet, we have to look at a metric called FFO-to-total debt. This tells us how long it will take OPI to pay off its debt using its income from its main business activities, and gives us an insight into OPI’s ability to service its borrowings. With a ratio of 4.0%, the credit rating agency Standard & Poor would consider this as aggressive risk. This would take OPI 25.08 years to pay off using just operating income, which is a long time, and risk increases with time. But realistically, companies have many levers to pull in order to pay back their debt, beyond operating income alone.
I also look at OPI's interest coverage ratio, which demonstrates how many times its earnings can cover its yearly interest expense. This is similar to the concept above, but looks at the upcoming obligations. The ratio is typically calculated using EBIT, but for a REIT stock, it's better to use FFO divided by net interest. With an interest coverage ratio of 1.44x, OPI is not generating an appropriate amount of cash from its borrowings. Typically, a ratio of greater than 3x is seen as safe.
I also use FFO to look at OPI's valuation relative to other REITs in United States by using the price-to-FFO metric. This is conceptually the same as the price-to-earnings (PE) ratio, but as previously mentioned, FFO is more suitable. In OPI’s case its P/FFO is 9.48x, compared to the long-term industry average of 16.5x, meaning that it is undervalued.
Next Steps:
Office Properties Income Trust can bring diversification into your portfolio due to its unique REIT characteristics. Before you make a decision on the stock today, keep in mind I've only covered one metric in this article, the FFO, which is by no means comprehensive. I'd strongly recommend continuing your research on the following areas I believe are key fundamentals for OPI:
- Future Outlook: What are well-informed industry analysts predicting for OPI’s future growth? Take a look at our free research report of analyst consensus for OPI’s outlook.
- Valuation: What is OPI worth today? Is the stock undervalued, even when its growth outlook is factored into its intrinsic value? The intrinsic value infographic in our free research report helps visualize whether OPI is currently mispriced by the market.
- Other High-Performing Stocks: Are there other stocks that provide better prospects with proven track records? Explore our free list of these great stocks here.
We aim to bring you long-term focused research analysis driven by fundamental data. Note that our analysis may not factor in the latest price-sensitive company announcements or qualitative material.
If you spot an error that warrants correction, please contact the editor at editorial-team@simplywallst.com. This article by Simply Wall St is general in nature. It does not constitute a recommendation to buy or sell any stock, and does not take account of your objectives, or your financial situation. Simply Wall St has no position in the stocks mentioned. Thank you for reading.
About NasdaqGS:OPI
Office Properties Income Trust
OPI is a national REIT focused on owning and leasing office properties to high credit quality tenants in markets throughout the United States.
Moderate, good value and pays a dividend.
Similar Companies
Market Insights


Advertisement
Community Narratives
The Future of Drug Testing? Fingerprint Tech Shows Serious Promise
Fair Value US$2.98|38.6% undervalued
JO
Community Contributor
Suncorp’s Next Chapter: Insurance-Only and Ready to Grow
Fair Value AU$22.83|8.8% undervalued
RO
Community Contributor
Thyssenkrupp Nucera Will Achieve Double-Digit Profits by 2030 Boosted by Hydrogen Growth
Fair Value €14.40|31.6% undervalued
CH
Community Contributor
Tesla’s Nvidia Moment – The AI & Robotics Inflection Point
Fair Value US$384.84|18.0% undervalued
BL
Community Contributor