Advertisement
- United States
- /
- Real Estate
- /
- NYSE:CBRE
How Solid Is CBRE Group After Recent 20% Rally in 2025?

Simply Wall St
Reviewed by Bailey Pemberton
Are you weighing your next move with CBRE Group stock? It is a decision that is catching more eyes lately, with CBRE’s chart showing a mix of staying power and fresh volatility. After an impressive run over the last few years, with gains of more than 210.4% over five years and 124.8% over the last three, the stock has cooled slightly in the past month, down 5.0%. Still, year to date, CBRE has notched a robust 20.2% gain, reflecting optimism as commercial real estate braces for continued recovery and investors increasingly seek long-term resilience in turbulent markets. The most recent seven-day slip of 1.8% feels minor against such a powerful upward trend, hinting that investors might just be catching their breath or taking stock of broader shifts in market risk appetite.
When it comes to valuation, there is no denying the facts: on our standard valuation checks, CBRE comes up as undervalued in zero out of six categories, which translates into a value score of 0. That number can sound stark, but as any savvy investor will tell you, there is more nuance hidden behind the headline figures. Next up, we will dig into how each major approach sizes up CBRE. We will also examine why these classic methods only tell part of the story. By the end, we will explore a better way to see the company’s true worth, one that goes beyond the usual playbook.
CBRE Group scores just 0/6 on our valuation checks. See what other red flags we found in the full valuation breakdown.
Approach 1: CBRE Group Discounted Cash Flow (DCF) Analysis
The Discounted Cash Flow (DCF) model is a cornerstone for investors aiming to estimate a company's true worth. It works by projecting future cash flows, or how much money the company is expected to generate each year, and then discounting those values back to today. This reflects the idea that cash received in the future is worth less than cash received now.
For CBRE Group, the analysis starts with its current Free Cash Flow (FCF) of $1.08 billion. Analysts forecast steady growth over the next few years, projecting FCF to rise to $2.74 billion by 2029. While estimates are concrete for five years out, Simply Wall St extrapolates further to provide ten-year projections, revealing continued momentum in cash flow growth.
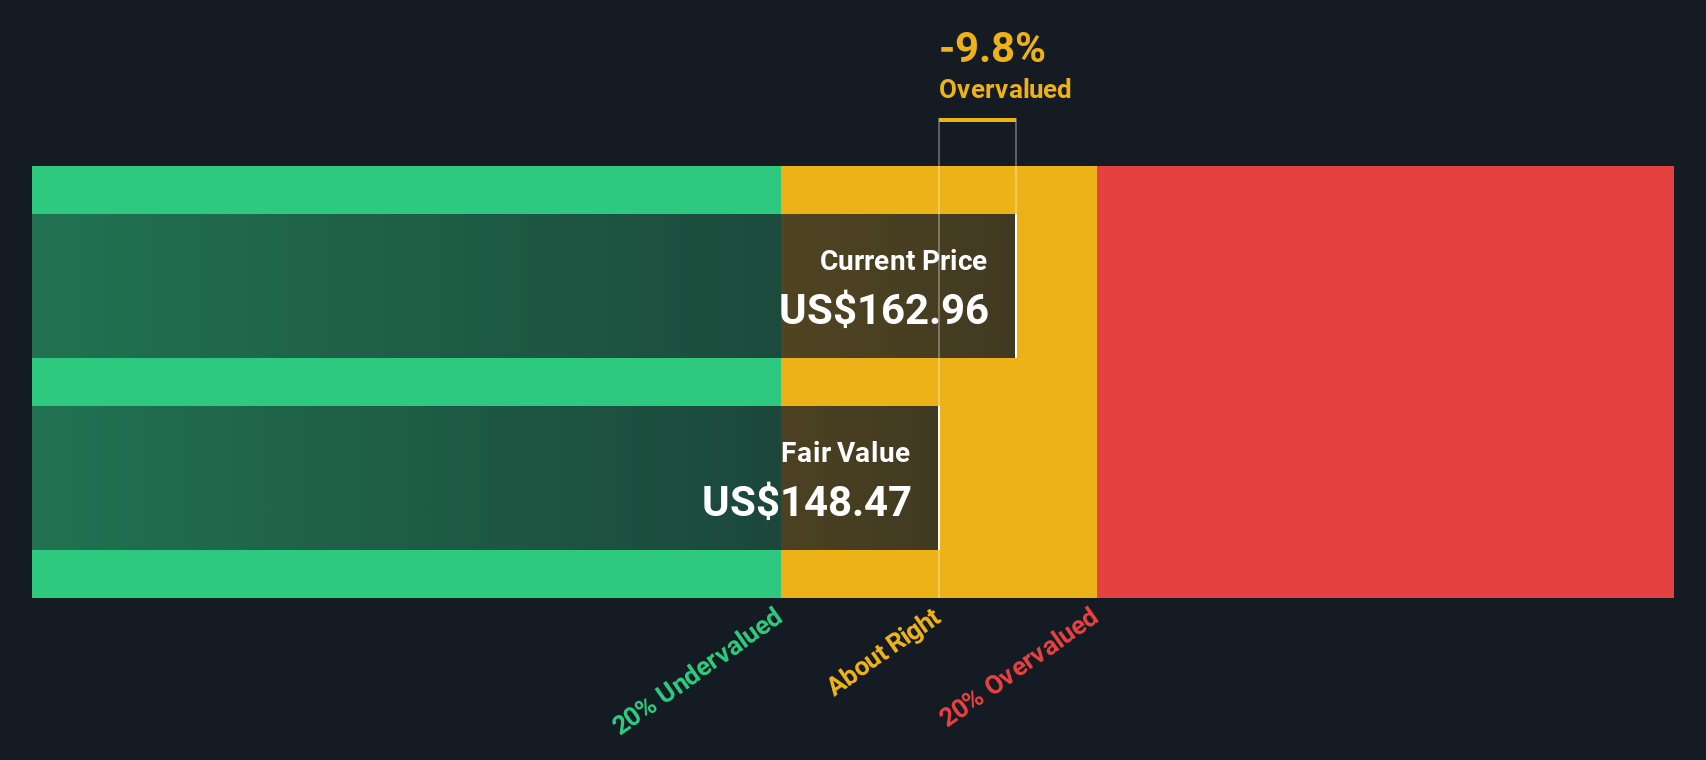
Applying these forecasts, the DCF model calculates an estimated intrinsic value per CBRE share of $155.55. When compared to the present market price, this suggests the stock is trading about 0.4% above its intrinsic value. In short, CBRE Group’s current price is virtually in line with what its future cash flows imply it is worth.
Result: ABOUT RIGHT
Simply Wall St performs a valuation analysis on every stock in the world every day (check out CBRE Group's valuation analysis). We show the entire calculation in full. You can track the result in your watchlist or portfolio and be alerted when this changes.
Approach 2: CBRE Group Price vs Earnings
For profitable companies like CBRE Group, the Price-to-Earnings (PE) ratio is a widely used valuation tool, as it reflects how much investors are willing to pay for each dollar of a company's earnings. It's a straightforward metric that helps put a company's valuation into context relative to its financial performance.
However, what counts as a "fair" PE ratio depends on more than just profits. Factors like expected earnings growth and the level of risk the company faces both push the PE ratio up or down. Higher growth typically justifies a higher PE, while added risk tends to lower it. This is why investors also compare a company's PE to those of its industry peers and sector averages.
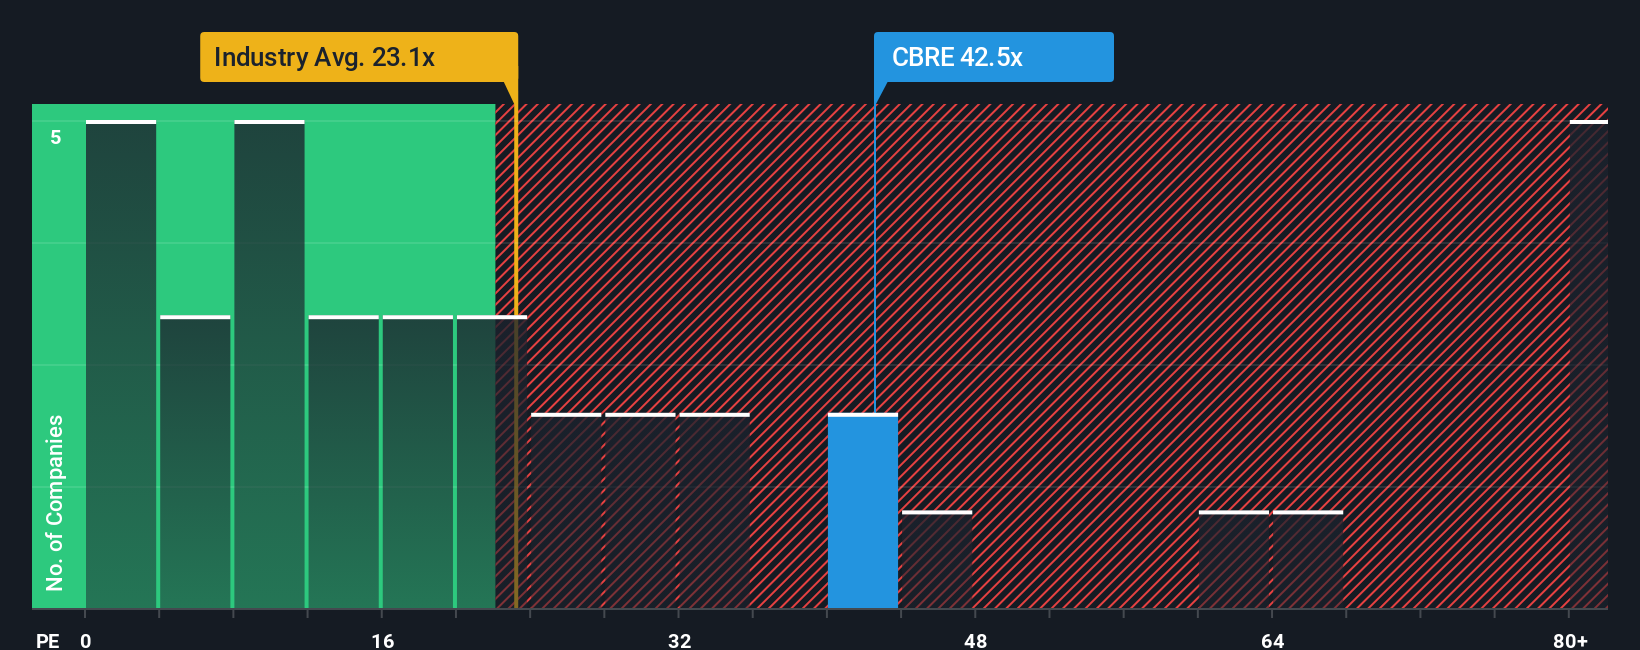
Right now, CBRE Group trades at a PE ratio of 42x. This is well above the real estate industry average of 24.2x and the average among listed peers, which sits around 31.4x. However, Simply Wall St's proprietary "Fair Ratio" model, which accounts for CBRE's size, growth, profitability, and risk profile, pins its fair PE at 27.1x. This tailored fair value approach is more insightful than broad industry comparisons, as it customizes expectations specifically for CBRE's financial strengths and challenges.
Since the current PE of 42x is notably higher than the Fair Ratio of 27.1x, the stock appears overvalued based on this metric.
Result: OVERVALUED
PE ratios tell one story, but what if the real opportunity lies elsewhere? Discover companies where insiders are betting big on explosive growth.
Upgrade Your Decision Making: Choose your CBRE Group Narrative
Earlier we mentioned that there is an even better way to understand valuation, so let us introduce you to Narratives. A Narrative is simply your story or viewpoint on a company like CBRE Group. It is where you connect the facts, forecasts, and your own perspective about what makes the business succeed or struggle.
Instead of relying on just one fair value calculation, Narratives let you build a scenario by outlining your assumptions about future revenue, profit margins, and what the stock should be worth, all in one place. This unique approach links the company’s journey directly to a financial forecast and ultimately, a Fair Value.
On Simply Wall St’s Community page, millions of investors use Narratives to clarify their stance and quickly compare their personalized Fair Value with the current market price. This helps them decide if now is the time to buy or sell. Narratives are easy to set up, flexible, and automatically update when new news or earnings data is released, so your decision making evolves as the facts change.
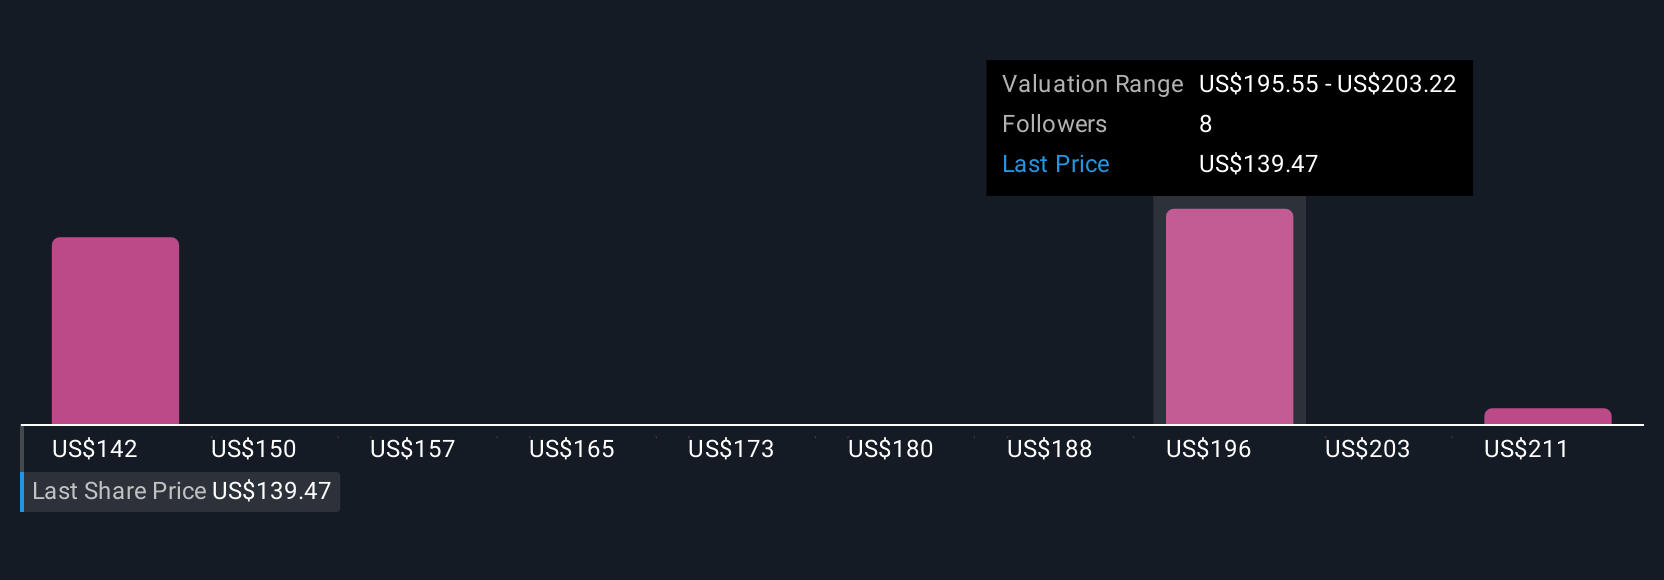
For example, some CBRE Group investors might build a bullish Narrative based on strong M&A potential and resilient business lines, targeting a price above $190. Others may take a cautious approach, expecting economic challenges and setting Fair Value closer to $115. Narratives empower you to invest with clarity, confidence, and your own view of what matters most.
Do you think there's more to the story for CBRE Group? Create your own Narrative to let the Community know!
This article by Simply Wall St is general in nature. We provide commentary based on historical data and analyst forecasts only using an unbiased methodology and our articles are not intended to be financial advice. It does not constitute a recommendation to buy or sell any stock, and does not take account of your objectives, or your financial situation. We aim to bring you long-term focused analysis driven by fundamental data. Note that our analysis may not factor in the latest price-sensitive company announcements or qualitative material. Simply Wall St has no position in any stocks mentioned.
New: AI Stock Screener & Alerts
Our new AI Stock Screener scans the market every day to uncover opportunities.
• Dividend Powerhouses (3%+ Yield)
• Undervalued Small Caps with Insider Buying
• High growth Tech and AI Companies
Or build your own from over 50 metrics.
Have feedback on this article? Concerned about the content? Get in touch with us directly. Alternatively, email editorial-team@simplywallst.com
About NYSE:CBRE
CBRE Group
Operates as a commercial real estate services and investment company in the United States, the United Kingdom, and internationally.
Proven track record with moderate growth potential.
Similar Companies
Market Insights

Advertisement
Community Narratives
The Next Phase of Energy Storage: How NeoVolta Is Tackling America’s Power Crunch
Fair Value US$7.50|35.1% undervalued
MA
Community Contributor
Why EnSilica is Worth Possibly 13x its Current Price
Fair Value UK£5.00|89.8% undervalued
DO
Community Contributor
M&A Activity, Industry Diversification & A Defense Contract Monopoly Will Push BWXT For Healthy Long-Term Growth
Fair Value US$220.00|15.2% undervalued
CL
Community Contributor
A case for Cassiar Gold Corp (TSXV: GLDC) to reach CAD$8-10 before 2030 (X30-37)
Fair Value CA$10.00|96.0% undervalued
AG
Community Contributor