Advertisement
- United States
- /
- Real Estate
- /
- NasdaqGS:NMRK
Is It Time to Reevaluate Newmark After Its Recent Double Digit Pullback?

Simply Wall St
Reviewed by Bailey Pemberton
Thinking about Newmark Group stock right now? You are not alone. Investors are weighing their next move after Newmark’s share price showed striking long-term growth but took a recent tumble, sparking fresh debate about whether it is a hidden gem or a stock to avoid. While the price pulled back by 8.6% over the last week and 10.1% over the past month, it is important to zoom out. Year-to-date, Newmark is up 34.8%, and for anyone holding over the long haul, the returns soar even higher: 250.4% over the past five years. Those numbers suggest long-term optimism has outweighed short-term jitters, reflecting both evolving market sentiment and the company’s ability to weather changing conditions, such as shifts in the commercial real estate sector that have altered how investors assess risk and opportunity.
But is Newmark Group actually undervalued right now, or is the market just catching its breath? To answer that, we can look at the company’s valuation score across a range of methods. Newmark checks the “undervalued” box in 2 out of 6 standard valuation tests, giving it a total score of 2. That is not overwhelming, but it is enough to keep value-focused investors interested, especially in light of those long-term returns.
Next, let us break down how each valuation approach sizes up Newmark’s potential, and why simply counting the checks might only be part of the story. There is a smarter way to gauge value, and we will get to that soon.
Newmark Group scores just 2/6 on our valuation checks. See what other red flags we found in the full valuation breakdown.
Approach 1: Newmark Group Discounted Cash Flow (DCF) Analysis
The Discounted Cash Flow (DCF) model estimates a company’s value by forecasting its future free cash flows and discounting them back to today’s dollars. This approach helps investors figure out what a business might be worth based on its predicted ability to generate cash over time.
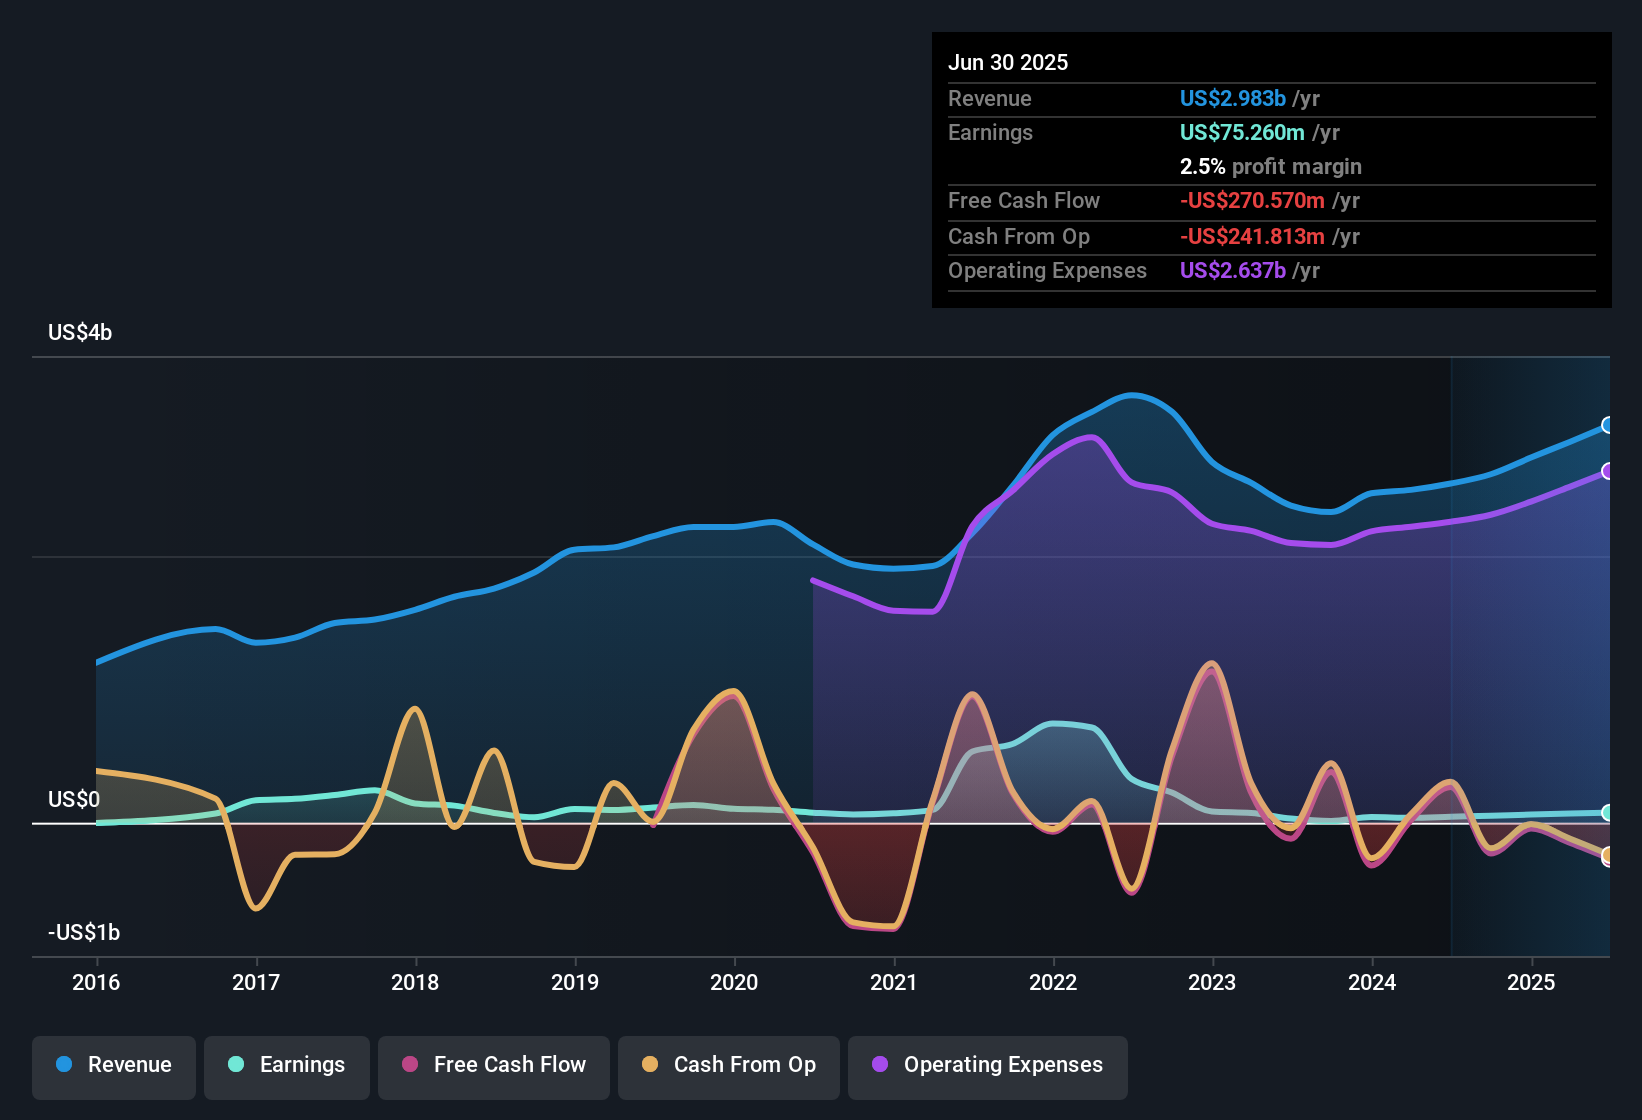
For Newmark Group, analysts estimate that the company’s current Free Cash Flow (FCF) is negative, sitting at -$297 million. However, projections show a significant turnaround ahead. Analyst estimates extend through 2029, with an FCF forecast of $456 million by that year. Simply Wall St extrapolates further growth into the next decade. Over the next ten years, annual FCF is projected to increase each year, indicating analyst confidence in rising profitability as the business adapts to industry shifts.
Based on these cash flow projections, the DCF model calculates an intrinsic value of $25.03 per share. Compared to Newmark’s current share price, this implies the stock trades at a 32.5% discount to its modeled fair value. That means, according to this method, Newmark is significantly undervalued by the market right now.
Result: UNDERVALUED
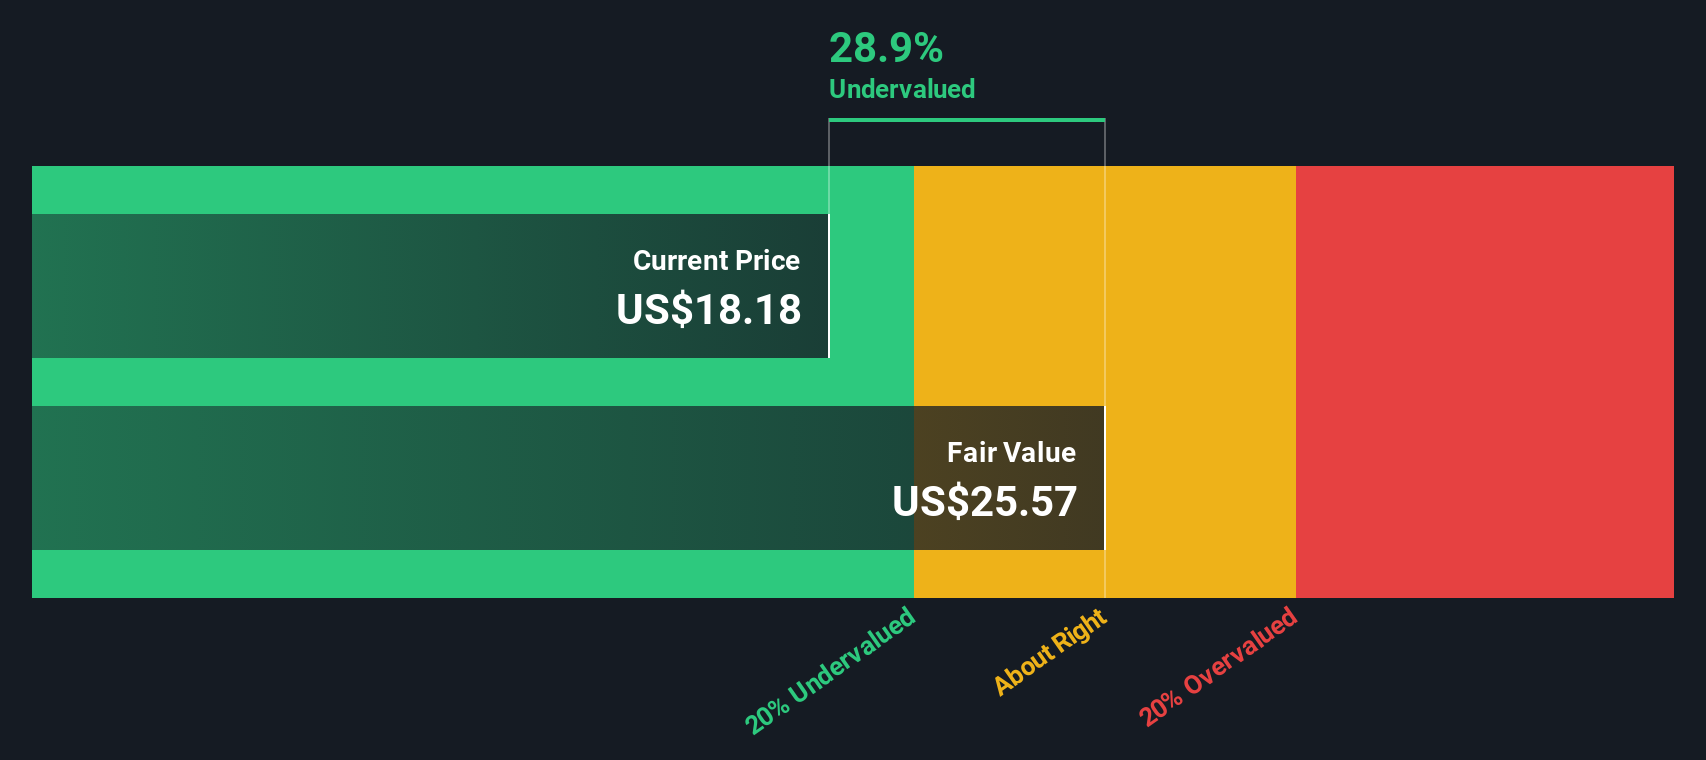
Our Discounted Cash Flow (DCF) analysis suggests Newmark Group is undervalued by 32.5%. Track this in your watchlist or portfolio, or discover more undervalued stocks.
Approach 2: Newmark Group Price vs Earnings
The Price-to-Earnings (PE) ratio is often the go-to metric for valuing profitable companies because it directly connects a company’s stock price with its earnings power. For investors, the PE ratio offers a straightforward view: how much they are paying for each dollar of current earnings. Typically, expectations for strong growth or lower risk will justify a higher PE ratio. In contrast, low growth or higher business risks justify a lower one.
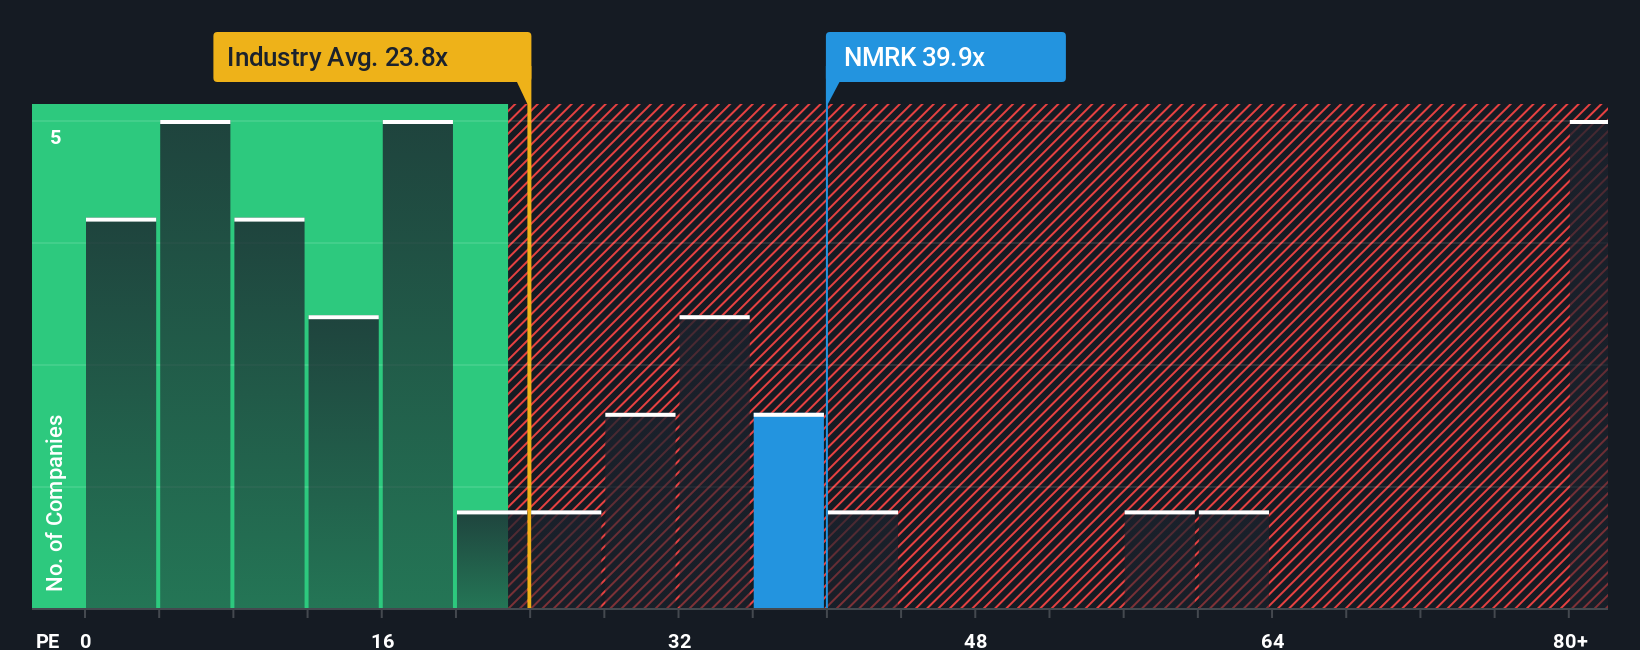
Newmark Group currently trades at a PE ratio of 39.7x. To put that in context, the average PE for other real estate companies is 24.1x, while the average among its closest peers is 30.3x. At first glance, Newmark’s PE stands well above these benchmarks, potentially signaling a premium compared to similar businesses in the sector.
However, Simply Wall St’s proprietary “Fair Ratio” considers a wider range of factors, such as the company’s growth outlook, profit margin, industry dynamics, market capitalization, and risk profile. With all these elements weighed, the Fair Ratio for Newmark comes in at 27.4x. This offers a more nuanced benchmark than just comparing against broad industry or peer averages, as it adjusts for what is truly appropriate for Newmark’s specific story and fundamentals.
Since Newmark’s current PE multiple of 39.7x is noticeably higher than its Fair Ratio of 27.4x, this approach suggests the stock is overvalued at current levels.
Result: OVERVALUED
PE ratios tell one story, but what if the real opportunity lies elsewhere? Discover companies where insiders are betting big on explosive growth.
Upgrade Your Decision Making: Choose your Newmark Group Narrative
Earlier we mentioned that there is an even better way to understand valuation, so let us introduce you to Narratives. A Narrative is your unique story about a company, where you combine your own views and expectations, such as future revenue growth, profit margins, and fair value, with the information behind the numbers. Rather than just relying on ratios and static models, Narratives help you connect Newmark Group’s business outlook to real forecasts and a personal estimate of fair value.
Narratives are available as an easy-to-use feature in the Simply Wall St Community, trusted by millions of investors, and make it simple to compare your view to others. By linking your perspective to a forecast and calculated value, you get a clear signal on whether Newmark Group is a buy or a sell based on your assumptions. As new information, news, or earnings are released, Narratives are updated in real time, keeping your analysis current and relevant.
For example, one investor might build a Narrative predicting that Newmark will reach $3.8 billion in revenue and a fair value of $22.25 if international expansion pays off, while another may anticipate margin pressures and see only $2.8 billion in revenue and a fair value of $14.00, highlighting how Narratives reflect the full range of viewpoints in the market.
Do you think there's more to the story for Newmark Group? Create your own Narrative to let the Community know!
This article by Simply Wall St is general in nature. We provide commentary based on historical data and analyst forecasts only using an unbiased methodology and our articles are not intended to be financial advice. It does not constitute a recommendation to buy or sell any stock, and does not take account of your objectives, or your financial situation. We aim to bring you long-term focused analysis driven by fundamental data. Note that our analysis may not factor in the latest price-sensitive company announcements or qualitative material. Simply Wall St has no position in any stocks mentioned.
Valuation is complex, but we're here to simplify it.
Discover if Newmark Group might be undervalued or overvalued with our detailed analysis, featuring fair value estimates, potential risks, dividends, insider trades, and its financial condition.
Access Free AnalysisHave feedback on this article? Concerned about the content? Get in touch with us directly. Alternatively, email editorial-team@simplywallst.com
About NasdaqGS:NMRK
Newmark Group
Provides commercial real estate services in the United States, the United Kingdom, and internationally.
Proven track record with adequate balance sheet.
Similar Companies
Market Insights

Advertisement
Community Narratives
A formidable player in AI and enterprise computing.
Fair Value US$210.00|12.2% overvalued
CO
Community Contributor
IREN's Bold Moves in Sustainable Bitcoin Mining & AI Data Centers
Fair Value US$72.52|17.1% undervalued
BL
Community Contributor
Cooling the Champions: The Aussie Tech Behind F1's Victories
Fair Value AU$12.40|38.1% undervalued
TR
Community Contributor