
Key Insights
- Using the 2 Stage Free Cash Flow to Equity, Qiagen fair value estimate is US$41.90
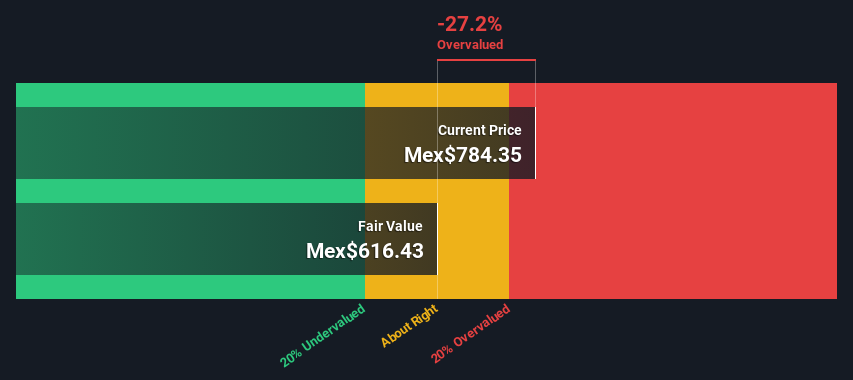
- Current share price of US$43.82 suggests Qiagen is potentially trading close to its fair value
- The US$50.29 analyst price target for QGEN is 20% more than our estimate of fair value
How far off is Qiagen N.V. (NYSE:QGEN) from its intrinsic value? Using the most recent financial data, we'll take a look at whether the stock is fairly priced by taking the forecast future cash flows of the company and discounting them back to today's value. One way to achieve this is by employing the Discounted Cash Flow (DCF) model. Believe it or not, it's not too difficult to follow, as you'll see from our example!
We would caution that there are many ways of valuing a company and, like the DCF, each technique has advantages and disadvantages in certain scenarios. If you still have some burning questions about this type of valuation, take a look at the Simply Wall St analysis model.
Check out our latest analysis for Qiagen
What's The Estimated Valuation?
We use what is known as a 2-stage model, which simply means we have two different periods of growth rates for the company's cash flows. Generally the first stage is higher growth, and the second stage is a lower growth phase. To begin with, we have to get estimates of the next ten years of cash flows. Where possible we use analyst estimates, but when these aren't available we extrapolate the previous free cash flow (FCF) from the last estimate or reported value. We assume companies with shrinking free cash flow will slow their rate of shrinkage, and that companies with growing free cash flow will see their growth rate slow, over this period. We do this to reflect that growth tends to slow more in the early years than it does in later years.
Generally we assume that a dollar today is more valuable than a dollar in the future, so we discount the value of these future cash flows to their estimated value in today's dollars:
10-year free cash flow (FCF) estimate
| 2024 | 2025 | 2026 | 2027 | 2028 | 2029 | 2030 | 2031 | 2032 | 2033 | |
| Levered FCF ($, Millions) | US$440.3m | US$494.9m | US$480.9m | US$475.3m | US$474.7m | US$477.6m | US$482.8m | US$489.9m | US$498.3m | US$507.7m |
| Growth Rate Estimate Source | Analyst x5 | Analyst x5 | Analyst x3 | Est @ -1.16% | Est @ -0.13% | Est @ 0.60% | Est @ 1.11% | Est @ 1.46% | Est @ 1.71% | Est @ 1.88% |
| Present Value ($, Millions) Discounted @ 6.8% | US$412 | US$434 | US$394 | US$365 | US$341 | US$321 | US$304 | US$288 | US$275 | US$262 |
("Est" = FCF growth rate estimated by Simply Wall St)
Present Value of 10-year Cash Flow (PVCF) = US$3.4b
After calculating the present value of future cash flows in the initial 10-year period, we need to calculate the Terminal Value, which accounts for all future cash flows beyond the first stage. The Gordon Growth formula is used to calculate Terminal Value at a future annual growth rate equal to the 5-year average of the 10-year government bond yield of 2.3%. We discount the terminal cash flows to today's value at a cost of equity of 6.8%.
Terminal Value (TV)= FCF2033 × (1 + g) ÷ (r – g) = US$508m× (1 + 2.3%) ÷ (6.8%– 2.3%) = US$11b
Present Value of Terminal Value (PVTV)= TV / (1 + r)10= US$11b÷ ( 1 + 6.8%)10= US$5.9b
The total value, or equity value, is then the sum of the present value of the future cash flows, which in this case is US$9.3b. To get the intrinsic value per share, we divide this by the total number of shares outstanding. Relative to the current share price of US$43.8, the company appears around fair value at the time of writing. Valuations are imprecise instruments though, rather like a telescope - move a few degrees and end up in a different galaxy. Do keep this in mind.
Important Assumptions
We would point out that the most important inputs to a discounted cash flow are the discount rate and of course the actual cash flows. You don't have to agree with these inputs, I recommend redoing the calculations yourself and playing with them. The DCF also does not consider the possible cyclicality of an industry, or a company's future capital requirements, so it does not give a full picture of a company's potential performance. Given that we are looking at Qiagen as potential shareholders, the cost of equity is used as the discount rate, rather than the cost of capital (or weighted average cost of capital, WACC) which accounts for debt. In this calculation we've used 6.8%, which is based on a levered beta of 0.990. Beta is a measure of a stock's volatility, compared to the market as a whole. We get our beta from the industry average beta of globally comparable companies, with an imposed limit between 0.8 and 2.0, which is a reasonable range for a stable business.
SWOT Analysis for Qiagen
- Debt is not viewed as a risk.
- Earnings declined over the past year.
- Expensive based on P/E ratio and estimated fair value.
- Annual earnings are forecast to grow for the next 3 years.
- Annual earnings are forecast to grow slower than the American market.
Looking Ahead:
Whilst important, the DCF calculation ideally won't be the sole piece of analysis you scrutinize for a company. The DCF model is not a perfect stock valuation tool. Instead the best use for a DCF model is to test certain assumptions and theories to see if they would lead to the company being undervalued or overvalued. If a company grows at a different rate, or if its cost of equity or risk free rate changes sharply, the output can look very different. For Qiagen, there are three additional elements you should assess:
- Risks: To that end, you should be aware of the 1 warning sign we've spotted with Qiagen .
- Future Earnings: How does QGEN's growth rate compare to its peers and the wider market? Dig deeper into the analyst consensus number for the upcoming years by interacting with our free analyst growth expectation chart.
- Other High Quality Alternatives: Do you like a good all-rounder? Explore our interactive list of high quality stocks to get an idea of what else is out there you may be missing!
PS. Simply Wall St updates its DCF calculation for every American stock every day, so if you want to find the intrinsic value of any other stock just search here.
Valuation is complex, but we're here to simplify it.
Discover if Qiagen might be undervalued or overvalued with our detailed analysis, featuring fair value estimates, potential risks, dividends, insider trades, and its financial condition.
Access Free AnalysisHave feedback on this article? Concerned about the content? Get in touch with us directly. Alternatively, email editorial-team (at) simplywallst.com.
This article by Simply Wall St is general in nature. We provide commentary based on historical data and analyst forecasts only using an unbiased methodology and our articles are not intended to be financial advice. It does not constitute a recommendation to buy or sell any stock, and does not take account of your objectives, or your financial situation. We aim to bring you long-term focused analysis driven by fundamental data. Note that our analysis may not factor in the latest price-sensitive company announcements or qualitative material. Simply Wall St has no position in any stocks mentioned.
About NYSE:QGEN
Qiagen
Offers sample to insight solutions that transform biological materials into molecular insights.
Flawless balance sheet and fair value.

