- United States
- /
- Biotech
- /
- NasdaqGS:YMAB
Y-mAbs Therapeutics, Inc.'s (NASDAQ:YMAB) Shares Bounce 66% But Its Business Still Trails The Industry

Y-mAbs Therapeutics, Inc. (NASDAQ:YMAB) shares have continued their recent momentum with a 66% gain in the last month alone. The annual gain comes to 293% following the latest surge, making investors sit up and take notice.
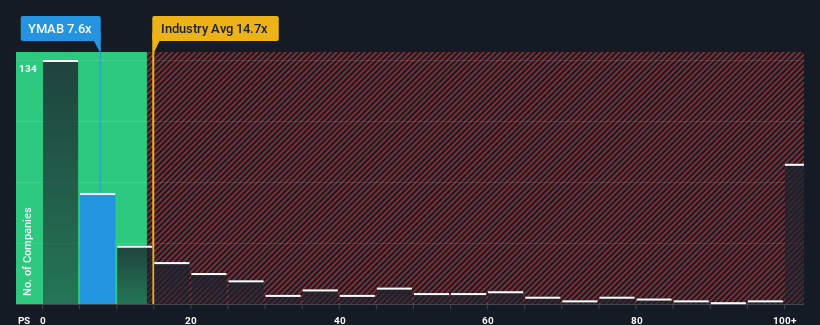
Even after such a large jump in price, Y-mAbs Therapeutics may still be sending buy signals at present with its price-to-sales (or "P/S") ratio of 7.6x, considering almost half of all companies in the Biotechs industry in the United States have P/S ratios greater than 14.7x and even P/S higher than 62x aren't out of the ordinary. Although, it's not wise to just take the P/S at face value as there may be an explanation why it's limited.
Check out our latest analysis for Y-mAbs Therapeutics

What Does Y-mAbs Therapeutics' P/S Mean For Shareholders?
Y-mAbs Therapeutics certainly has been doing a good job lately as it's been growing revenue more than most other companies. Perhaps the market is expecting future revenue performance to dive, which has kept the P/S suppressed. If not, then existing shareholders have reason to be quite optimistic about the future direction of the share price.
If you'd like to see what analysts are forecasting going forward, you should check out our free report on Y-mAbs Therapeutics.What Are Revenue Growth Metrics Telling Us About The Low P/S?
The only time you'd be truly comfortable seeing a P/S as low as Y-mAbs Therapeutics' is when the company's growth is on track to lag the industry.
Retrospectively, the last year delivered an exceptional 114% gain to the company's top line. Although, its longer-term performance hasn't been as strong with three-year revenue growth being relatively non-existent overall. So it appears to us that the company has had a mixed result in terms of growing revenue over that time.
Turning to the outlook, the next three years should generate growth of 9.4% per annum as estimated by the six analysts watching the company. Meanwhile, the rest of the industry is forecast to expand by 254% each year, which is noticeably more attractive.
In light of this, it's understandable that Y-mAbs Therapeutics' P/S sits below the majority of other companies. It seems most investors are expecting to see limited future growth and are only willing to pay a reduced amount for the stock.
The Final Word
Despite Y-mAbs Therapeutics' share price climbing recently, its P/S still lags most other companies. We'd say the price-to-sales ratio's power isn't primarily as a valuation instrument but rather to gauge current investor sentiment and future expectations.
As we suspected, our examination of Y-mAbs Therapeutics' analyst forecasts revealed that its inferior revenue outlook is contributing to its low P/S. Right now shareholders are accepting the low P/S as they concede future revenue probably won't provide any pleasant surprises. It's hard to see the share price rising strongly in the near future under these circumstances.
You should always think about risks. Case in point, we've spotted 4 warning signs for Y-mAbs Therapeutics you should be aware of, and 1 of them can't be ignored.
If companies with solid past earnings growth is up your alley, you may wish to see this free collection of other companies with strong earnings growth and low P/E ratios.
If you're looking to trade Y-mAbs Therapeutics, open an account with the lowest-cost platform trusted by professionals, Interactive Brokers.
With clients in over 200 countries and territories, and access to 160 markets, IBKR lets you trade stocks, options, futures, forex, bonds and funds from a single integrated account.
Enjoy no hidden fees, no account minimums, and FX conversion rates as low as 0.03%, far better than what most brokers offer.
Sponsored ContentNew: Manage All Your Stock Portfolios in One Place
We've created the ultimate portfolio companion for stock investors, and it's free.
• Connect an unlimited number of Portfolios and see your total in one currency
• Be alerted to new Warning Signs or Risks via email or mobile
• Track the Fair Value of your stocks
Have feedback on this article? Concerned about the content? Get in touch with us directly. Alternatively, email editorial-team (at) simplywallst.com.
This article by Simply Wall St is general in nature. We provide commentary based on historical data and analyst forecasts only using an unbiased methodology and our articles are not intended to be financial advice. It does not constitute a recommendation to buy or sell any stock, and does not take account of your objectives, or your financial situation. We aim to bring you long-term focused analysis driven by fundamental data. Note that our analysis may not factor in the latest price-sensitive company announcements or qualitative material. Simply Wall St has no position in any stocks mentioned.
About NasdaqGS:YMAB
Y-mAbs Therapeutics
A commercial-stage biopharmaceutical company, focuses on the development and commercialization of radioimmunotherapy and antibody based therapeutic products for the treatment of cancer in the United States and internationally.
Flawless balance sheet and fair value.


