
Advertisement
Howard Marks put it nicely when he said that, rather than worrying about share price volatility, 'The possibility of permanent loss is the risk I worry about... and every practical investor I know worries about.' When we think about how risky a company is, we always like to look at its use of debt, since debt overload can lead to ruin. As with many other companies Exagen Inc. (NASDAQ:XGN) makes use of debt. But the more important question is: how much risk is that debt creating?
Why Does Debt Bring Risk?
Generally speaking, debt only becomes a real problem when a company can't easily pay it off, either by raising capital or with its own cash flow. Part and parcel of capitalism is the process of 'creative destruction' where failed businesses are mercilessly liquidated by their bankers. However, a more usual (but still expensive) situation is where a company must dilute shareholders at a cheap share price simply to get debt under control. Of course, debt can be an important tool in businesses, particularly capital heavy businesses. When we think about a company's use of debt, we first look at cash and debt together.
Check out our latest analysis for Exagen
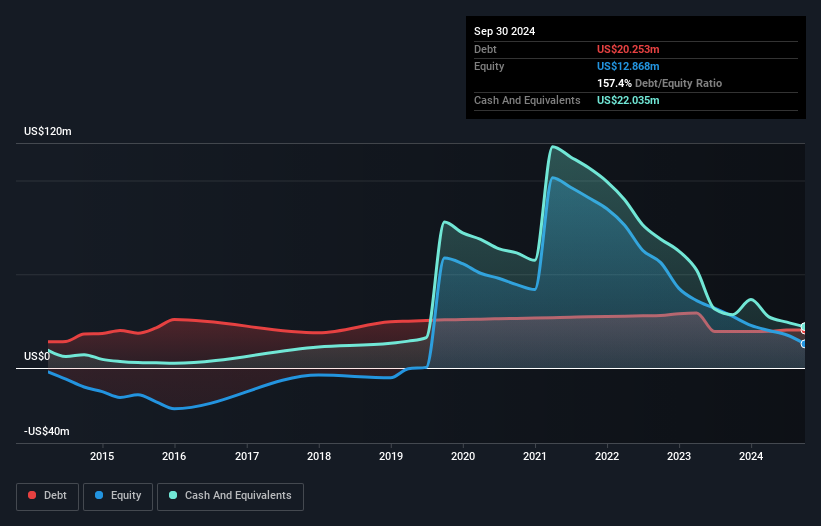
What Is Exagen's Debt?
As you can see below, at the end of September 2024, Exagen had US$20.3m of debt, up from US$19.5m a year ago. Click the image for more detail. But on the other hand it also has US$22.0m in cash, leading to a US$1.78m net cash position.
A Look At Exagen's Liabilities
The latest balance sheet data shows that Exagen had liabilities of US$8.78m due within a year, and liabilities of US$22.0m falling due after that. Offsetting these obligations, it had cash of US$22.0m as well as receivables valued at US$9.39m due within 12 months. So it actually has US$685.0k more liquid assets than total liabilities.
This state of affairs indicates that Exagen's balance sheet looks quite solid, as its total liabilities are just about equal to its liquid assets. So while it's hard to imagine that the US$61.0m company is struggling for cash, we still think it's worth monitoring its balance sheet. Simply put, the fact that Exagen has more cash than debt is arguably a good indication that it can manage its debt safely. When analysing debt levels, the balance sheet is the obvious place to start. But it is future earnings, more than anything, that will determine Exagen's ability to maintain a healthy balance sheet going forward. So if you want to see what the professionals think, you might find this free report on analyst profit forecasts to be interesting.
Over 12 months, Exagen reported revenue of US$56m, which is a gain of 8.0%, although it did not report any earnings before interest and tax. We usually like to see faster growth from unprofitable companies, but each to their own.
So How Risky Is Exagen?
Statistically speaking companies that lose money are riskier than those that make money. And in the last year Exagen had an earnings before interest and tax (EBIT) loss, truth be told. Indeed, in that time it burnt through US$5.8m of cash and made a loss of US$17m. But the saving grace is the US$1.78m on the balance sheet. That means it could keep spending at its current rate for more than two years. Overall, its balance sheet doesn't seem overly risky, at the moment, but we're always cautious until we see the positive free cash flow. There's no doubt that we learn most about debt from the balance sheet. But ultimately, every company can contain risks that exist outside of the balance sheet. To that end, you should learn about the 3 warning signs we've spotted with Exagen (including 1 which is a bit unpleasant) .
If you're interested in investing in businesses that can grow profits without the burden of debt, then check out this free list of growing businesses that have net cash on the balance sheet.
Valuation is complex, but we're here to simplify it.
Discover if Exagen might be undervalued or overvalued with our detailed analysis, featuring fair value estimates, potential risks, dividends, insider trades, and its financial condition.
Access Free AnalysisHave feedback on this article? Concerned about the content? Get in touch with us directly. Alternatively, email editorial-team (at) simplywallst.com.
This article by Simply Wall St is general in nature. We provide commentary based on historical data and analyst forecasts only using an unbiased methodology and our articles are not intended to be financial advice. It does not constitute a recommendation to buy or sell any stock, and does not take account of your objectives, or your financial situation. We aim to bring you long-term focused analysis driven by fundamental data. Note that our analysis may not factor in the latest price-sensitive company announcements or qualitative material. Simply Wall St has no position in any stocks mentioned.
About NasdaqGM:XGN
Exagen
Designs, develops, and commercializes various testing products under the AVISE brand in the United States.
Undervalued with adequate balance sheet.
Similar Companies
Market Insights

Advertisement
Community Narratives
MINISO's fair value is projected at 26.69 with an anticipated PE ratio shift of 20x
Fair Value US$24.03|11.4% undervalued
BE
Community Contributor
Procter & Gamble: A Dividend Giant Facing Slowing Growth
Fair Value US$119.81|23.5% overvalued
AN
Community Contributor
Eli Lilly's Future Growth Driven by Tirzepatide and Favorable Market Conditions
Fair Value US$1.19k|14.0% undervalued
EA
Community Contributor