
Advertisement
- United States
- /
- Biotech
- /
- NasdaqCM:VRDN
Is Viridian Therapeutics (NASDAQ:VRDN) Weighed On By Its Debt Load?

Warren Buffett famously said, 'Volatility is far from synonymous with risk.' When we think about how risky a company is, we always like to look at its use of debt, since debt overload can lead to ruin. We can see that Viridian Therapeutics, Inc. (NASDAQ:VRDN) does use debt in its business. But the real question is whether this debt is making the company risky.
Why Does Debt Bring Risk?
Debt is a tool to help businesses grow, but if a business is incapable of paying off its lenders, then it exists at their mercy. In the worst case scenario, a company can go bankrupt if it cannot pay its creditors. However, a more common (but still painful) scenario is that it has to raise new equity capital at a low price, thus permanently diluting shareholders. Of course, debt can be an important tool in businesses, particularly capital heavy businesses. When we think about a company's use of debt, we first look at cash and debt together.
Check out our latest analysis for Viridian Therapeutics
How Much Debt Does Viridian Therapeutics Carry?
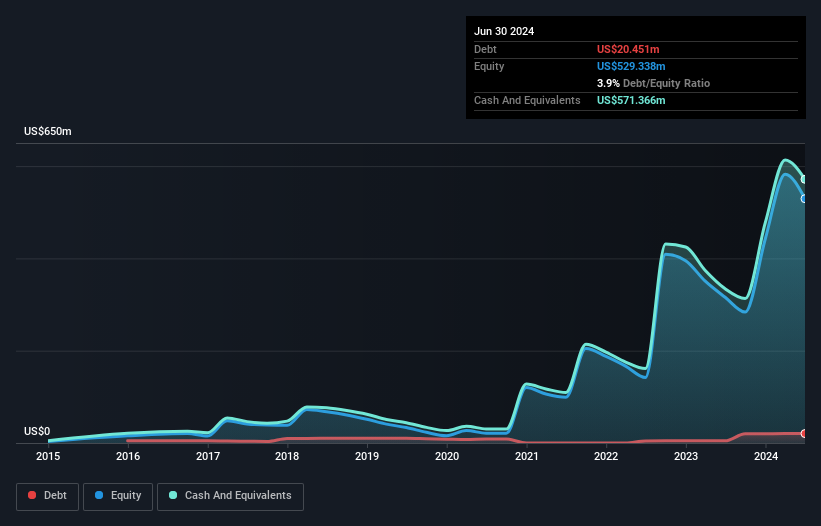
You can click the graphic below for the historical numbers, but it shows that as of June 2024 Viridian Therapeutics had US$20.5m of debt, an increase on US$4.71m, over one year. But on the other hand it also has US$571.4m in cash, leading to a US$550.9m net cash position.
A Look At Viridian Therapeutics' Liabilities
Zooming in on the latest balance sheet data, we can see that Viridian Therapeutics had liabilities of US$36.8m due within 12 months and liabilities of US$19.6m due beyond that. On the other hand, it had cash of US$571.4m and US$102.0k worth of receivables due within a year. So it can boast US$515.1m more liquid assets than total liabilities.
This excess liquidity is a great indication that Viridian Therapeutics' balance sheet is almost as strong as Fort Knox. Having regard to this fact, we think its balance sheet is as strong as an ox. Simply put, the fact that Viridian Therapeutics has more cash than debt is arguably a good indication that it can manage its debt safely. The balance sheet is clearly the area to focus on when you are analysing debt. But it is future earnings, more than anything, that will determine Viridian Therapeutics's ability to maintain a healthy balance sheet going forward. So if you're focused on the future you can check out this free report showing analyst profit forecasts.
Since Viridian Therapeutics doesn't have significant operating revenue, shareholders may be hoping it comes up with a great new product, before it runs out of money.
So How Risky Is Viridian Therapeutics?
By their very nature companies that are losing money are more risky than those with a long history of profitability. And we do note that Viridian Therapeutics had an earnings before interest and tax (EBIT) loss, over the last year. Indeed, in that time it burnt through US$169m of cash and made a loss of US$228m. While this does make the company a bit risky, it's important to remember it has net cash of US$550.9m. That kitty means the company can keep spending for growth for at least two years, at current rates. Overall, its balance sheet doesn't seem overly risky, at the moment, but we're always cautious until we see the positive free cash flow. There's no doubt that we learn most about debt from the balance sheet. But ultimately, every company can contain risks that exist outside of the balance sheet. For instance, we've identified 4 warning signs for Viridian Therapeutics (1 can't be ignored) you should be aware of.
At the end of the day, it's often better to focus on companies that are free from net debt. You can access our special list of such companies (all with a track record of profit growth). It's free.
New: Manage All Your Stock Portfolios in One Place
We've created the ultimate portfolio companion for stock investors, and it's free.
• Connect an unlimited number of Portfolios and see your total in one currency
• Be alerted to new Warning Signs or Risks via email or mobile
• Track the Fair Value of your stocks
Have feedback on this article? Concerned about the content? Get in touch with us directly. Alternatively, email editorial-team (at) simplywallst.com.
This article by Simply Wall St is general in nature. We provide commentary based on historical data and analyst forecasts only using an unbiased methodology and our articles are not intended to be financial advice. It does not constitute a recommendation to buy or sell any stock, and does not take account of your objectives, or your financial situation. We aim to bring you long-term focused analysis driven by fundamental data. Note that our analysis may not factor in the latest price-sensitive company announcements or qualitative material. Simply Wall St has no position in any stocks mentioned.
About NasdaqCM:VRDN
Viridian Therapeutics
Engages in discovering, developing, and commercializing treatments for serious and rare diseases.
Flawless balance sheet and fair value.
Market Insights


Advertisement
Community Narratives
Nike's Direct-to-Consumer Focus Will Drive Future Growth
Fair Value US$87.90|18.2% undervalued
UN
Community Contributor
Novo Nordisk will dominate GLP-1 market with Ozempic and Wegovy growth
Fair Value US$89.59|12.1% undervalued
BE
Community Contributor
Rheinmetall could get 20-25% of EU-NATO 3%-GDP defence spending
Fair Value €7.57k|82.4% undervalued
NO
Community Contributor