- United States
- /
- Biotech
- /
- NasdaqCM:SGMO
Little Excitement Around Sangamo Therapeutics, Inc.'s (NASDAQ:SGMO) Revenues As Shares Take 36% Pounding


Sangamo Therapeutics, Inc. (NASDAQ:SGMO) shares have retraced a considerable 36% in the last month, reversing a fair amount of their solid recent performance. For any long-term shareholders, the last month ends a year to forget by locking in a 58% share price decline.
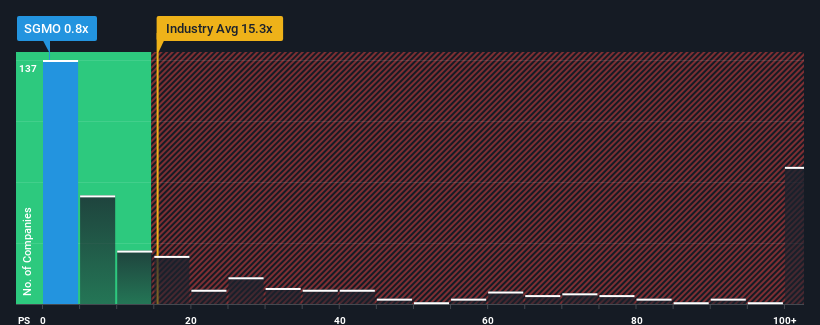
After such a large drop in price, Sangamo Therapeutics may be sending very bullish signals at the moment with its price-to-sales (or "P/S") ratio of 0.8x, since almost half of all companies in the Biotechs industry in the United States have P/S ratios greater than 15.3x and even P/S higher than 70x are not unusual. However, the P/S might be quite low for a reason and it requires further investigation to determine if it's justified.
Check out our latest analysis for Sangamo Therapeutics
How Has Sangamo Therapeutics Performed Recently?
Sangamo Therapeutics could be doing better as it's been growing revenue less than most other companies lately. It seems that many are expecting the uninspiring revenue performance to persist, which has repressed the growth of the P/S ratio. If this is the case, then existing shareholders will probably struggle to get excited about the future direction of the share price.
Keen to find out how analysts think Sangamo Therapeutics' future stacks up against the industry? In that case, our free report is a great place to start.Do Revenue Forecasts Match The Low P/S Ratio?
Sangamo Therapeutics' P/S ratio would be typical for a company that's expected to deliver very poor growth or even falling revenue, and importantly, perform much worse than the industry.
Taking a look back first, we see that the company grew revenue by an impressive 58% last year. The strong recent performance means it was also able to grow revenue by 49% in total over the last three years. Therefore, it's fair to say the revenue growth recently has been superb for the company.
Shifting to the future, estimates from the eight analysts covering the company suggest revenue growth is heading into negative territory, declining 23% each year over the next three years. Meanwhile, the broader industry is forecast to expand by 152% per year, which paints a poor picture.
With this information, we are not surprised that Sangamo Therapeutics is trading at a P/S lower than the industry. However, shrinking revenues are unlikely to lead to a stable P/S over the longer term. Even just maintaining these prices could be difficult to achieve as the weak outlook is weighing down the shares.
What We Can Learn From Sangamo Therapeutics' P/S?
Sangamo Therapeutics' P/S looks about as weak as its stock price lately. It's argued the price-to-sales ratio is an inferior measure of value within certain industries, but it can be a powerful business sentiment indicator.
It's clear to see that Sangamo Therapeutics maintains its low P/S on the weakness of its forecast for sliding revenue, as expected. Right now shareholders are accepting the low P/S as they concede future revenue probably won't provide any pleasant surprises. Unless these conditions improve, they will continue to form a barrier for the share price around these levels.
It's always necessary to consider the ever-present spectre of investment risk. We've identified 3 warning signs with Sangamo Therapeutics (at least 1 which is a bit concerning), and understanding these should be part of your investment process.
If these risks are making you reconsider your opinion on Sangamo Therapeutics, explore our interactive list of high quality stocks to get an idea of what else is out there.
If you're looking to trade Sangamo Therapeutics, open an account with the lowest-cost platform trusted by professionals, Interactive Brokers.
With clients in over 200 countries and territories, and access to 160 markets, IBKR lets you trade stocks, options, futures, forex, bonds and funds from a single integrated account.
Enjoy no hidden fees, no account minimums, and FX conversion rates as low as 0.03%, far better than what most brokers offer.
Sponsored ContentNew: Manage All Your Stock Portfolios in One Place
We've created the ultimate portfolio companion for stock investors, and it's free.
• Connect an unlimited number of Portfolios and see your total in one currency
• Be alerted to new Warning Signs or Risks via email or mobile
• Track the Fair Value of your stocks
Have feedback on this article? Concerned about the content? Get in touch with us directly. Alternatively, email editorial-team (at) simplywallst.com.
This article by Simply Wall St is general in nature. We provide commentary based on historical data and analyst forecasts only using an unbiased methodology and our articles are not intended to be financial advice. It does not constitute a recommendation to buy or sell any stock, and does not take account of your objectives, or your financial situation. We aim to bring you long-term focused analysis driven by fundamental data. Note that our analysis may not factor in the latest price-sensitive company announcements or qualitative material. Simply Wall St has no position in any stocks mentioned.
About NasdaqCM:SGMO
Sangamo Therapeutics
A clinical-stage genomic medicine company, focuses on translating science into medicines that transform the lives of patients and families afflicted with serious diseases in the United States.
Excellent balance sheet slight.
