
Advertisement
- United States
- /
- Biotech
- /
- NasdaqCM:SGMO
Lacklustre Performance Is Driving Sangamo Therapeutics, Inc.'s (NASDAQ:SGMO) 35% Price Drop
Unfortunately for some shareholders, the Sangamo Therapeutics, Inc. (NASDAQ:SGMO) share price has dived 35% in the last thirty days, prolonging recent pain. The recent drop completes a disastrous twelve months for shareholders, who are sitting on a 65% loss during that time.
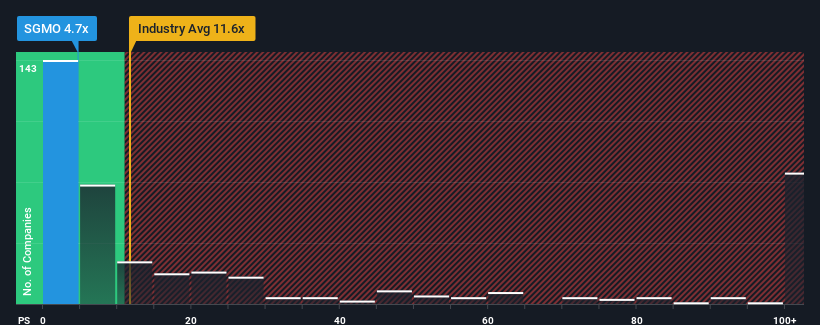
Following the heavy fall in price, Sangamo Therapeutics may be sending very bullish signals at the moment with its price-to-sales (or "P/S") ratio of 4.7x, since almost half of all companies in the Biotechs industry in the United States have P/S ratios greater than 11.6x and even P/S higher than 64x are not unusual. Nonetheless, we'd need to dig a little deeper to determine if there is a rational basis for the highly reduced P/S.
See our latest analysis for Sangamo Therapeutics
How Has Sangamo Therapeutics Performed Recently?
Sangamo Therapeutics hasn't been tracking well recently as its declining revenue compares poorly to other companies, which have seen some growth in their revenues on average. The P/S ratio is probably low because investors think this poor revenue performance isn't going to get any better. If you still like the company, you'd be hoping this isn't the case so that you could potentially pick up some stock while it's out of favour.
Want the full picture on analyst estimates for the company? Then our free report on Sangamo Therapeutics will help you uncover what's on the horizon.What Are Revenue Growth Metrics Telling Us About The Low P/S?
In order to justify its P/S ratio, Sangamo Therapeutics would need to produce anemic growth that's substantially trailing the industry.
In reviewing the last year of financials, we were disheartened to see the company's revenues fell to the tune of 92%. As a result, revenue from three years ago have also fallen 86% overall. Therefore, it's fair to say the revenue growth recently has been undesirable for the company.
Turning to the outlook, the next three years should generate growth of 81% per year as estimated by the seven analysts watching the company. Meanwhile, the rest of the industry is forecast to expand by 203% each year, which is noticeably more attractive.
In light of this, it's understandable that Sangamo Therapeutics' P/S sits below the majority of other companies. Apparently many shareholders weren't comfortable holding on while the company is potentially eyeing a less prosperous future.
What Does Sangamo Therapeutics' P/S Mean For Investors?
Having almost fallen off a cliff, Sangamo Therapeutics' share price has pulled its P/S way down as well. We'd say the price-to-sales ratio's power isn't primarily as a valuation instrument but rather to gauge current investor sentiment and future expectations.
We've established that Sangamo Therapeutics maintains its low P/S on the weakness of its forecast growth being lower than the wider industry, as expected. Right now shareholders are accepting the low P/S as they concede future revenue probably won't provide any pleasant surprises. Unless these conditions improve, they will continue to form a barrier for the share price around these levels.
It's always necessary to consider the ever-present spectre of investment risk. We've identified 5 warning signs with Sangamo Therapeutics (at least 1 which makes us a bit uncomfortable), and understanding them should be part of your investment process.
It's important to make sure you look for a great company, not just the first idea you come across. So if growing profitability aligns with your idea of a great company, take a peek at this free list of interesting companies with strong recent earnings growth (and a low P/E).
New: Manage All Your Stock Portfolios in One Place
We've created the ultimate portfolio companion for stock investors, and it's free.
• Connect an unlimited number of Portfolios and see your total in one currency
• Be alerted to new Warning Signs or Risks via email or mobile
• Track the Fair Value of your stocks
Have feedback on this article? Concerned about the content? Get in touch with us directly. Alternatively, email editorial-team (at) simplywallst.com.
This article by Simply Wall St is general in nature. We provide commentary based on historical data and analyst forecasts only using an unbiased methodology and our articles are not intended to be financial advice. It does not constitute a recommendation to buy or sell any stock, and does not take account of your objectives, or your financial situation. We aim to bring you long-term focused analysis driven by fundamental data. Note that our analysis may not factor in the latest price-sensitive company announcements or qualitative material. Simply Wall St has no position in any stocks mentioned.
Have feedback on this article? Concerned about the content? Get in touch with us directly. Alternatively, email editorial-team@simplywallst.com
About NasdaqCM:SGMO
Sangamo Therapeutics
A clinical-stage genomic medicine company, focuses on translating science into medicines that transform the lives of patients and families afflicted with serious diseases in the United States.
Excellent balance sheet and good value.
Similar Companies
Market Insights

Advertisement
Community Narratives
The Next Phase of Energy Storage: How NeoVolta Is Tackling America’s Power Crunch
Fair Value US$7.50|35.1% undervalued
MA
Community Contributor
Why EnSilica is Worth Possibly 13x its Current Price
Fair Value UK£5.00|89.8% undervalued
DO
Community Contributor
M&A Activity, Industry Diversification & A Defense Contract Monopoly Will Push BWXT For Healthy Long-Term Growth
Fair Value US$220.00|15.2% undervalued
CL
Community Contributor
A case for Cassiar Gold Corp (TSXV: GLDC) to reach CAD$8-10 before 2030 (X30-37)
Fair Value CA$10.00|96.0% undervalued
AG
Community Contributor